Top Reversal
Yard Charts technical analysis software is able to discover a Top Reversal chart pattern
Top reversal is a YardCharts trend inversion bearish pattern and can be expected to take form at market tops. It occurs as the result of an up-trend followed by a trading range that is followed by a further market rise and a sudden reversal of the self-same market rise.

- The market is visibly in an uptrend (see segment 1 in picture A) and appears poised to reach for new highs.
- At a certain stage during the up phase the market pauses for breath and forms a Trading-Range (see range in picture A). Having defined a clear range the market breaks yet again on the up side, appearing to resume its u-trend (see up break in picture A).
- However as soon as the up-break looks confirmed on a closing basis/non closing basis, the market unexpectedly turns and immediately falls back to close below the lower band of the range. This is delimited by a horizontal line (see reversal in picture A).
Development of a Top Reversal
The entry point for a bear trade or closing of a long position is at the break (on a closing base) of the range's lower band horizontal delimitation. It is important to consider the speed at which the market falls back from the recent market high to below the range to close below its lower band. The up-velocity from range lower band to the market recent high must be lower or equal to the down-velocity from the market top back to close down below the range lower delimitation. This translates into the leg, range-low to market top, being composed by a number of bars >= than the leg, market-high to range low. See picture B. If the market has indeed reversed, it should start declining from this point on. The first sign that these patterns are failing is when the market rises back above the range higher delimitation instead of declining. It is a definite failure if the markets takes out the last recent top. Depending on the investor's risk appetite, a stop loss should be placed either above the range higher band or no higher than the market recent top (see picture B).
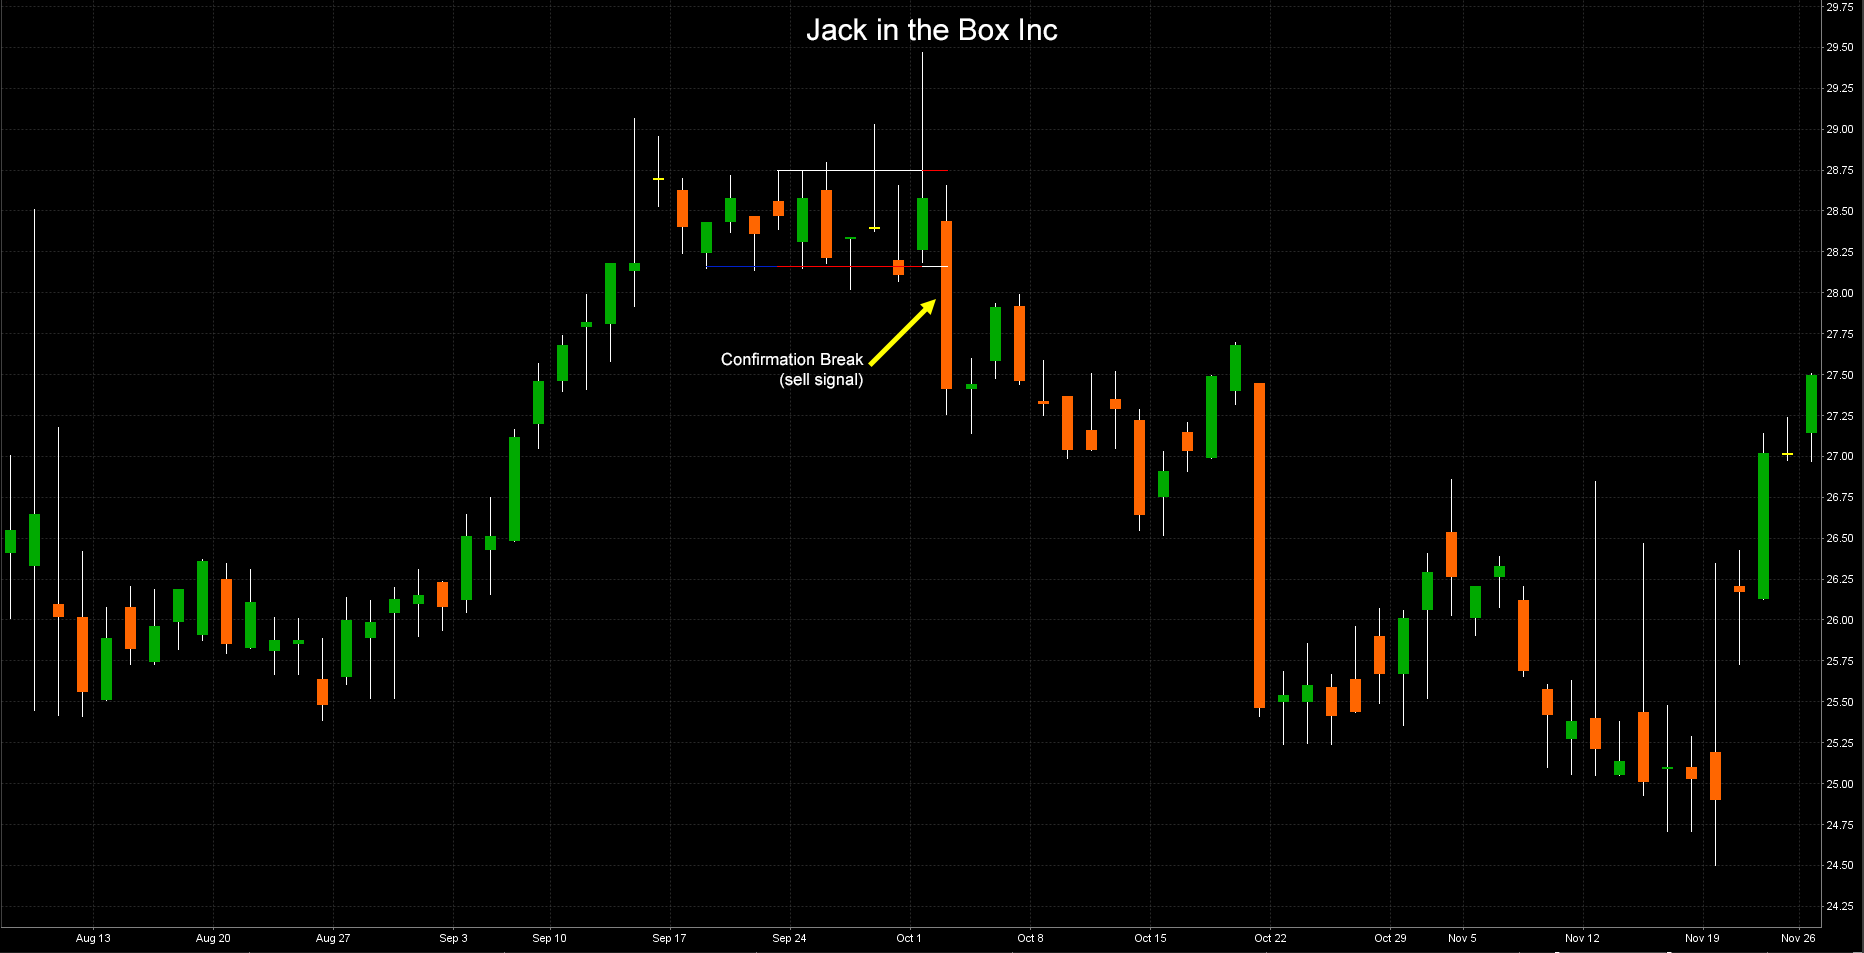
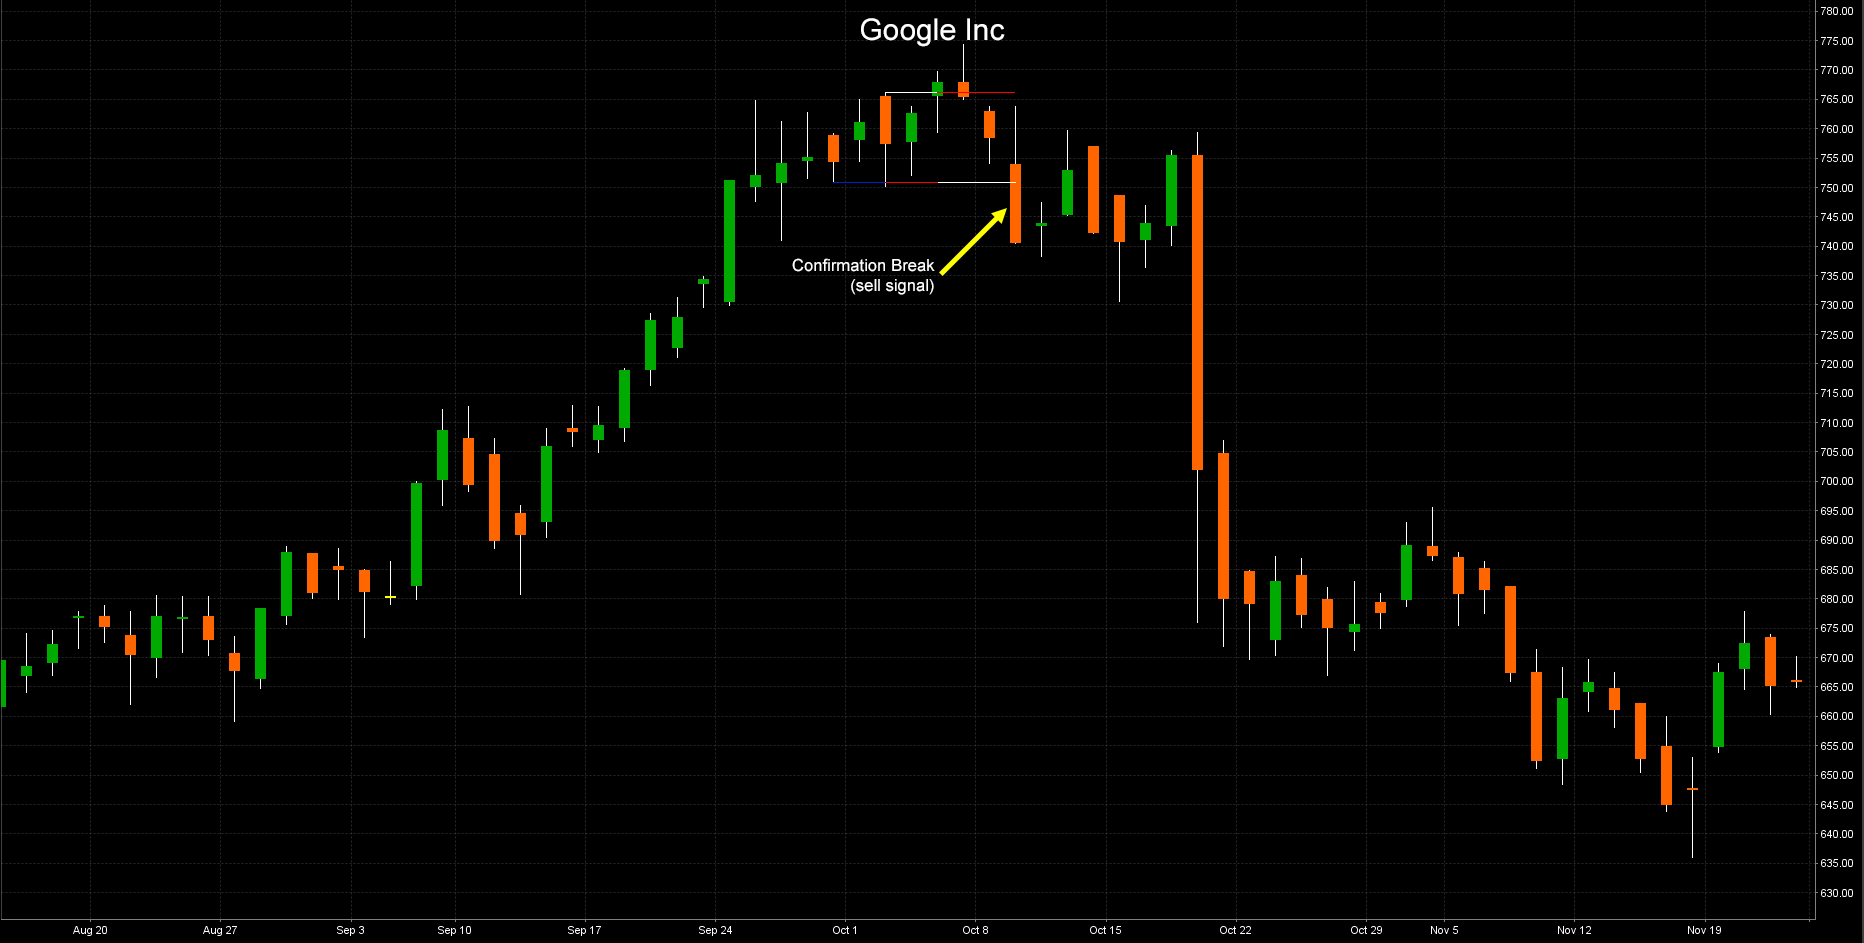
Cases in point
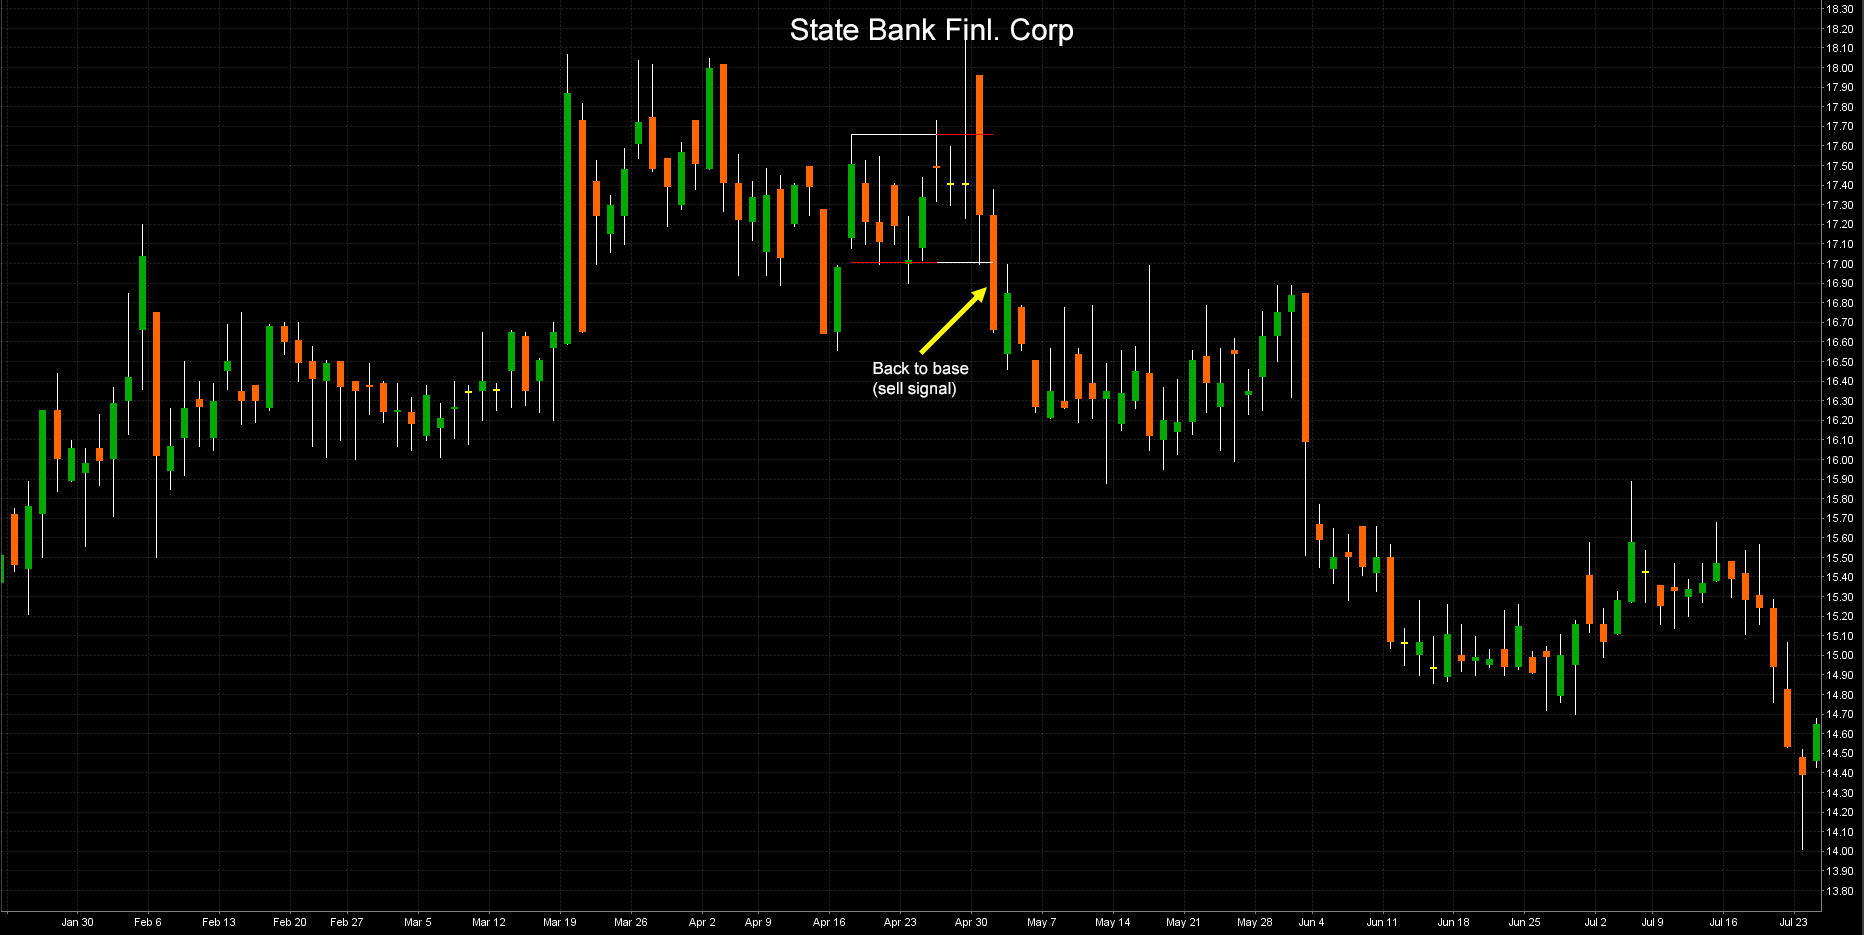
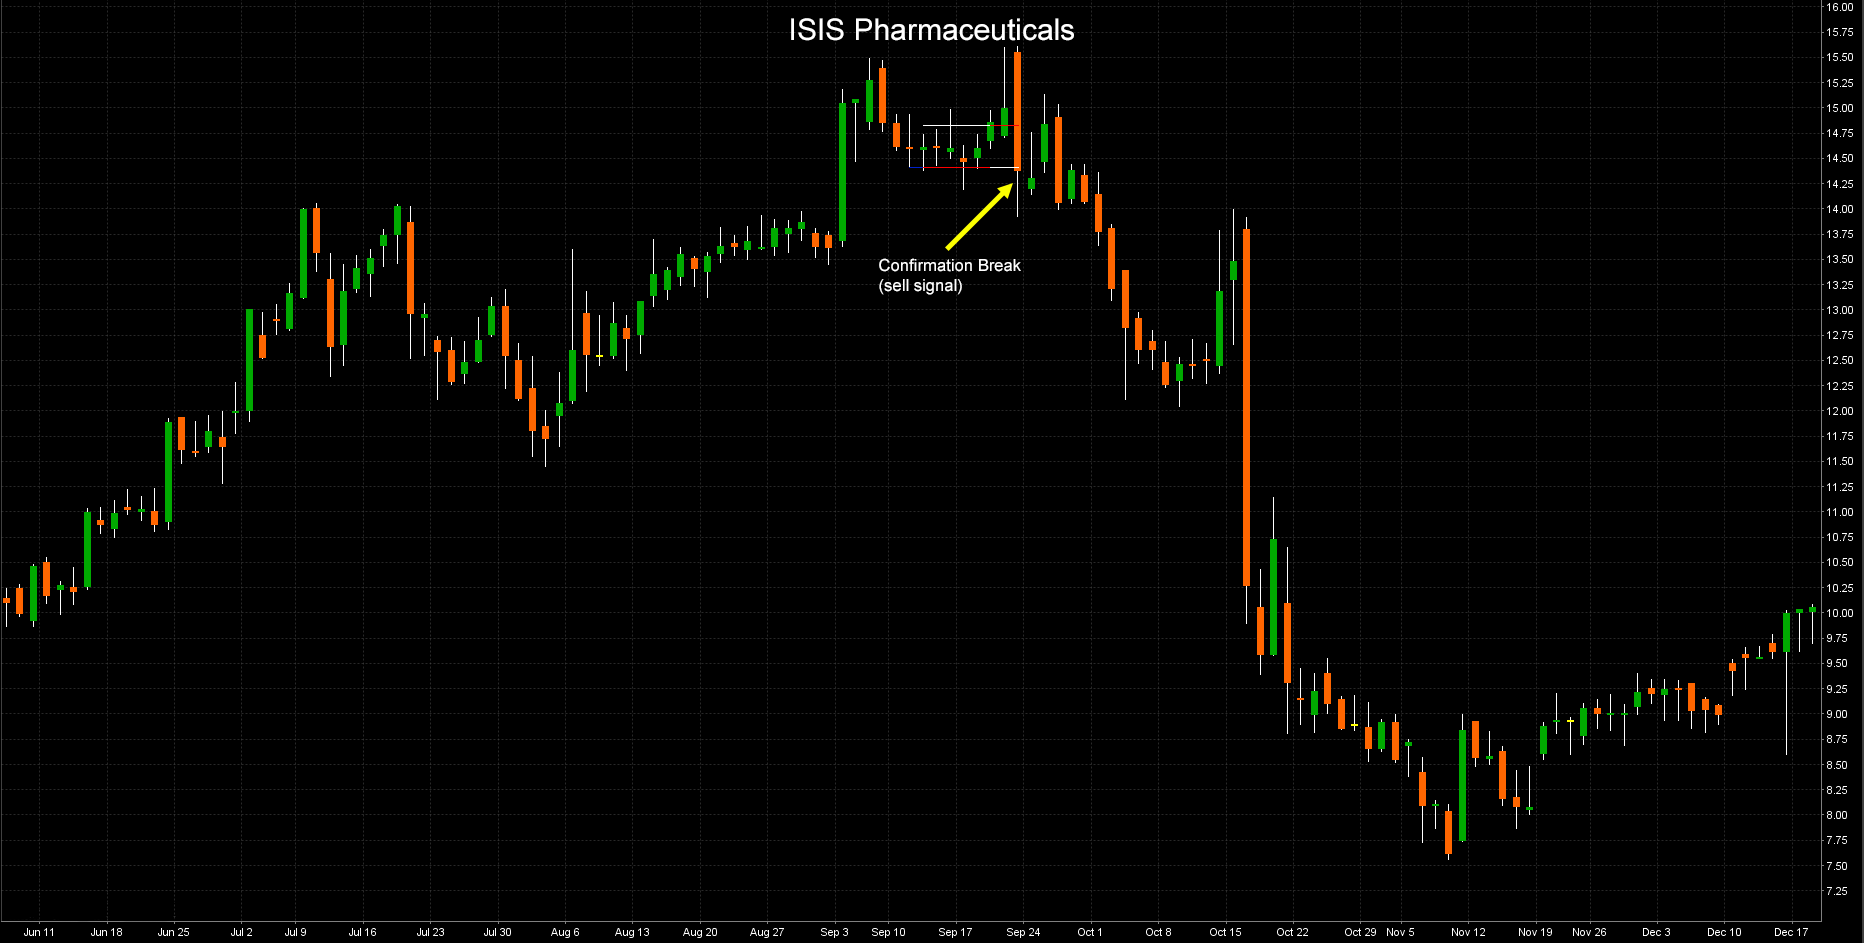
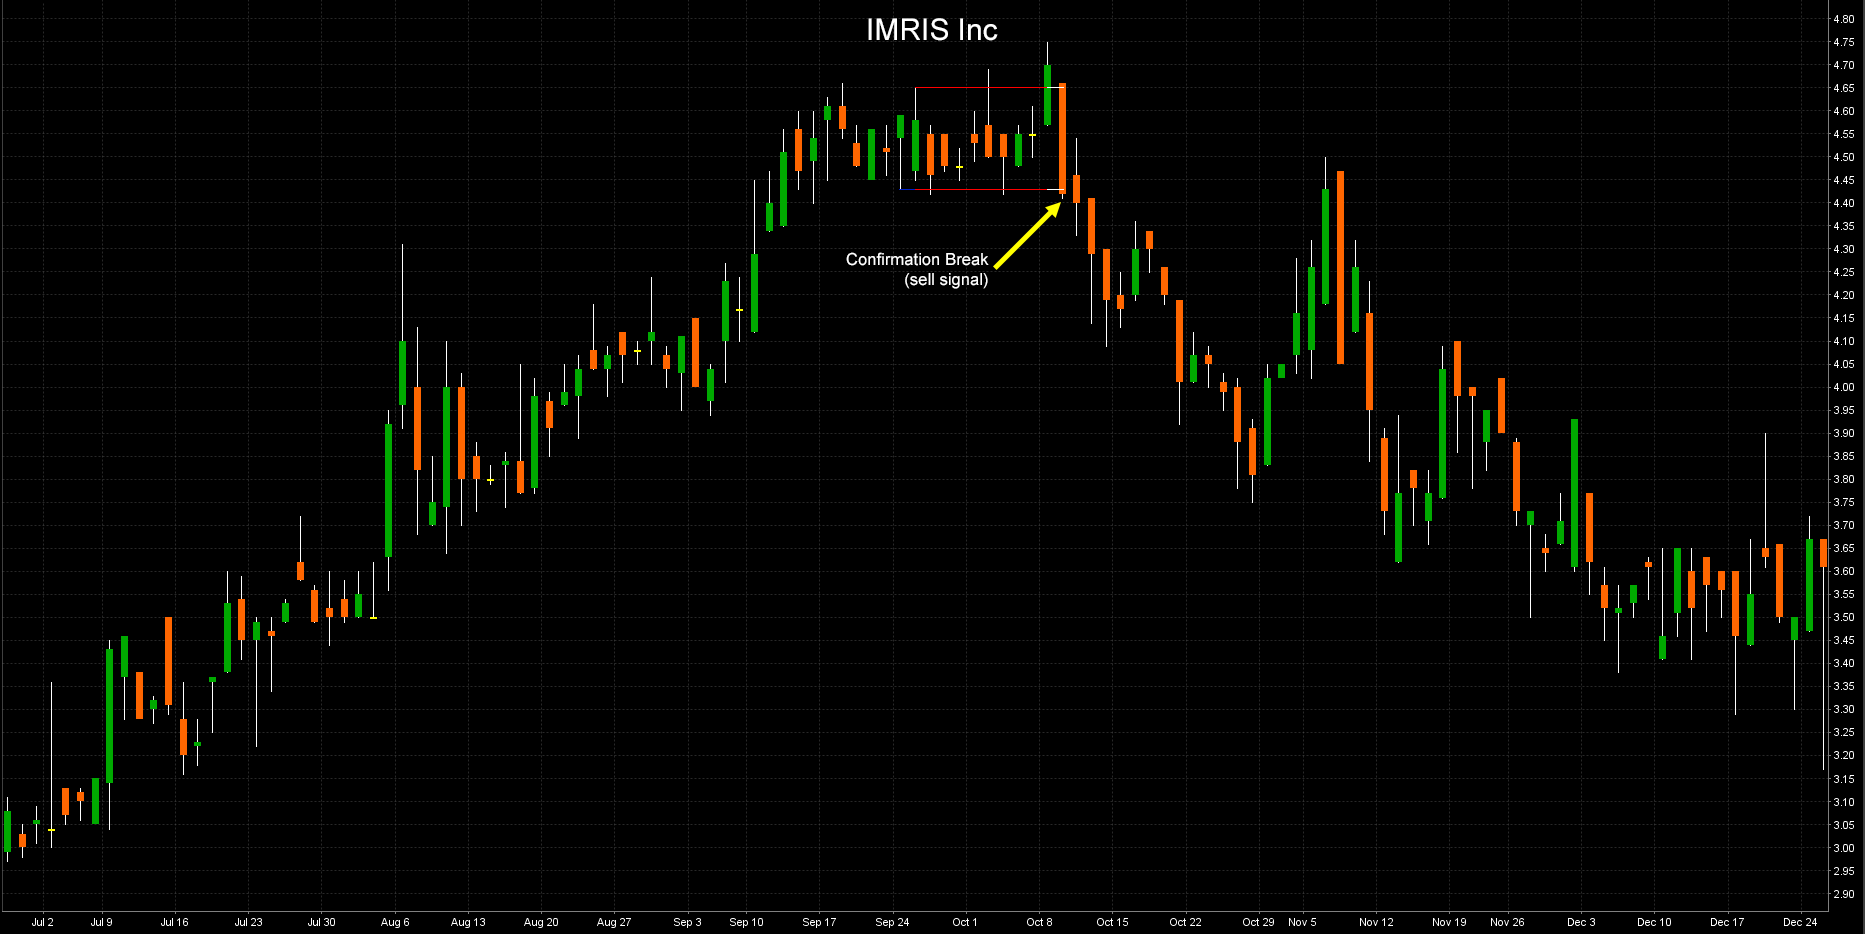
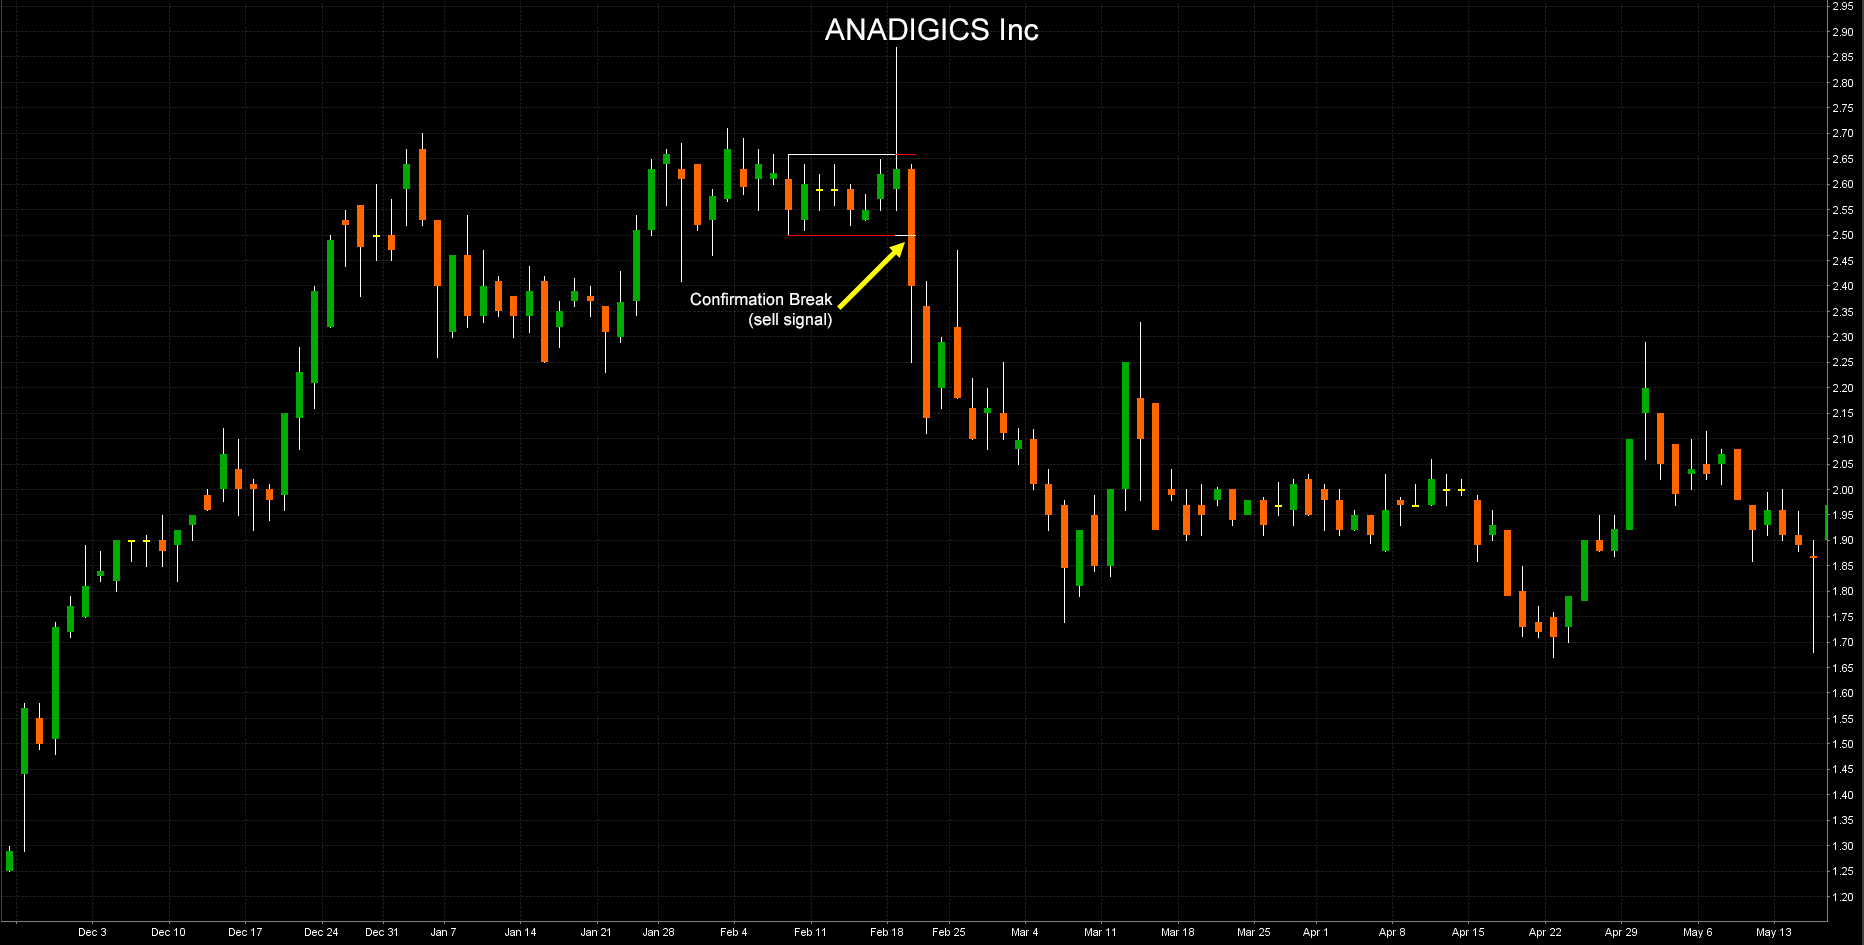
Below are shown six real Top Reversal alerts recently called by YardCharts that have successfully performed since the day of the sell alarm. In this case, success means that beginning from the entry point, the market in the particular stock has declined a distance at least equal to three times the range's High-Low band differential without first hitting the stop placed below the range higher band. The range segments and colors are shown exactly as they appear in YardCharts Alarm section.
Some Example
Read also about...


Free Yard Charts Panel
Experience Yard Charts features for free and get ready to use Yard Chart Plus. Check the stock market securities that Yard Chart suggested in the past!
It is very useful for new clients to check past alerts to better understand how the tool works and experiment with the services that YC offers. Even with a more basic functionality than YC plus, Free YC offers the investor the possibility to better understand alerts and feature.
Read moreYard Charts Plus Platform
The techincal analysis software decisive to understand the stock market trends. Through this automated charting tool, Yard Charts gives more insight and support to its clients.
Yard Charts plus is taught for private traders and institutions that are seeking an innovative technical tool to scan the stock market. A professional analitycal approach for more powerful and productive trading.
Read moreYard Charts PPV Platform
Thanks to this analytic tool, our clients can choose their desired alert and only pay for the stocks symbols that they want to see. Scan the stock market and get your alert!
This service is recommended for investors that possess high technical skills who would like to choose their desired alert and only pay for the stocks symbols that they want to see.
Read moreExperience Free Yard Charts, check some patterns!
Try Now