Bottom Right Triangle
Yard Charts technical analysis software is able to discover a Bottom Right Triangle chart pattern
Bottom Right Triangle is a YardCharts bullish reversal pattern comparable to an imaginary right triangle. It is made up of two sides joined at a 90° angle and linked by a hypotenuse. In financial technical analysis we make the following associations:

- Long side: The horizontal line drawn by uniting two or more approximately equal market highs in a given temporal segment. (See line 1, in picture A);
- Short side: The imaginary vertical line with a length that equals the distance from the horizontal line to the market low formed beneath the horizontal. (See line 2, in picture A);
- Hypotenuse: The imaginary sloping line that results from linking the market lows and corresponds to the bounces formed under the horizontal. (See line 3, in picture A).
The ideal model of Bottom Right Triangle
- There must be at least two, preferably three, bounces under the horizontal line with each corresponding to a market low. They must be in ascending order starting from the left.
- While these bounces are being formulated, it is recommended that the down-velocity from the horizontal to the market lows be slower than the up-velocity from the lows back to the horizontal. This results in the down-bars from the horizontal to the market lows being more or equal in number than the up-bars from the same lows back to the horizontal. Not all bounces in a triangle will develop exactly as such but it helps if this characteristic materializes before the break out, as these are triangles tend to perform better on average.
- The formation of a Bottom Right Triangle is confirmed when the market breaks and closes above the horizontal line after having previously formed at least two bounces. At this point we have a buy signal, and a stop loss must be placed just below the low of the last bounce before the break out. Picture B that depicts all these properties.

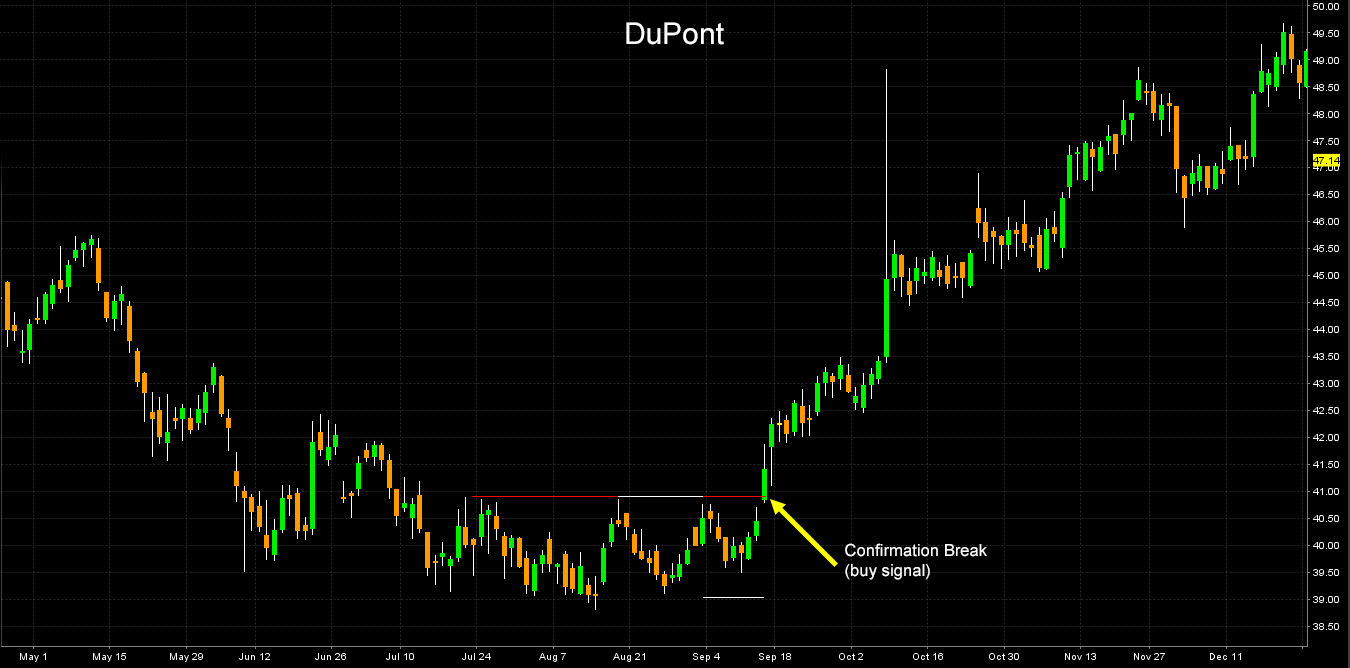
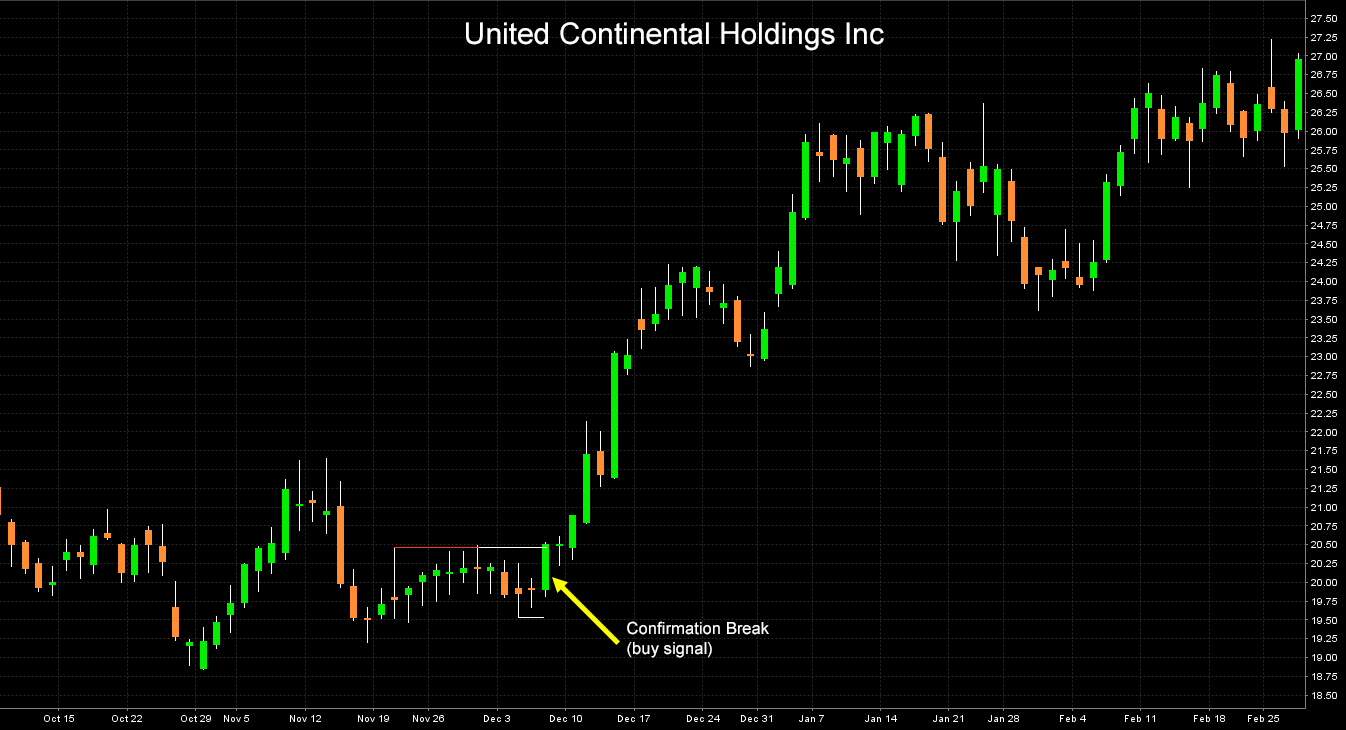
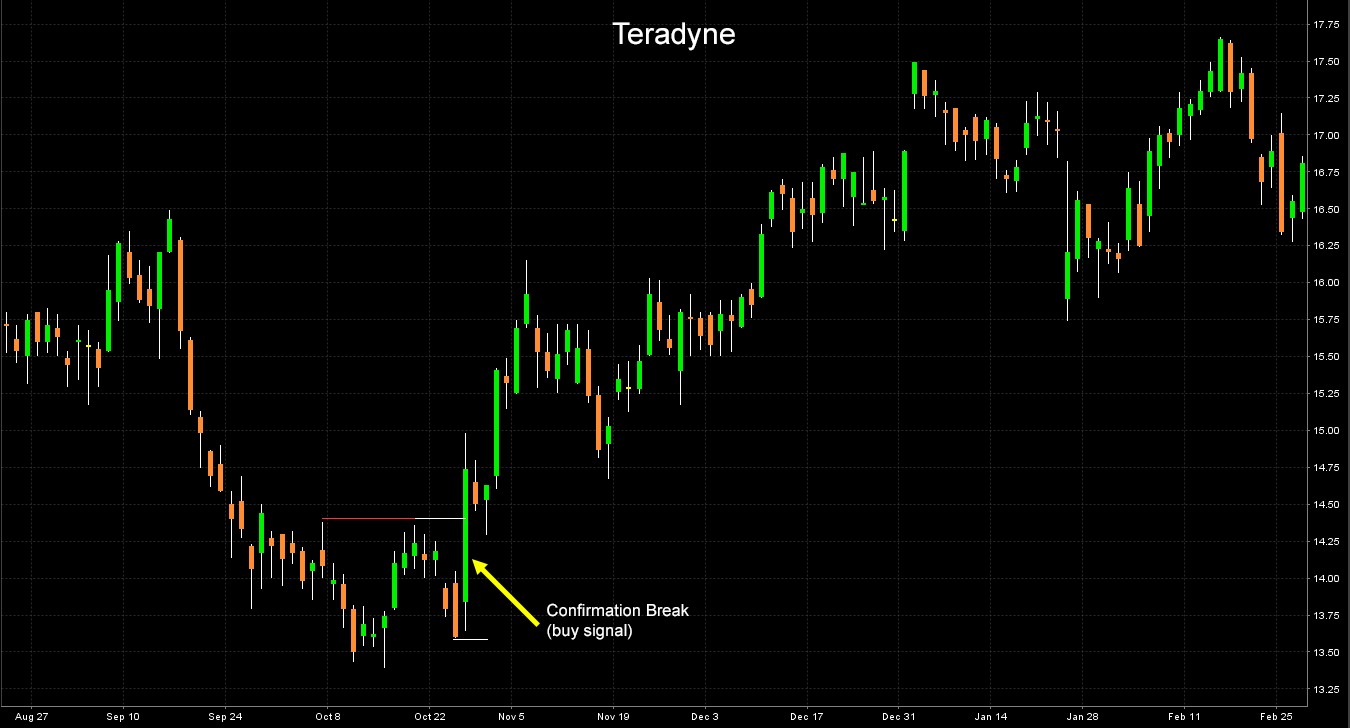
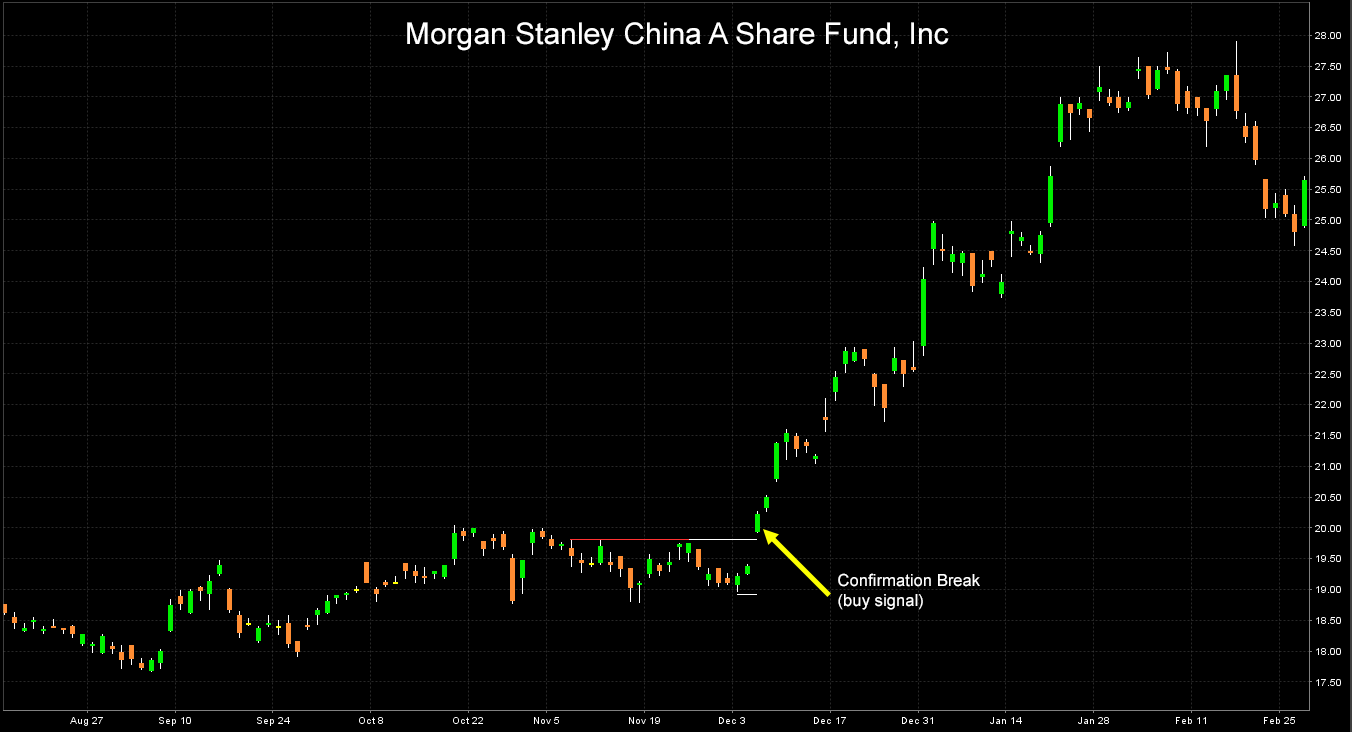
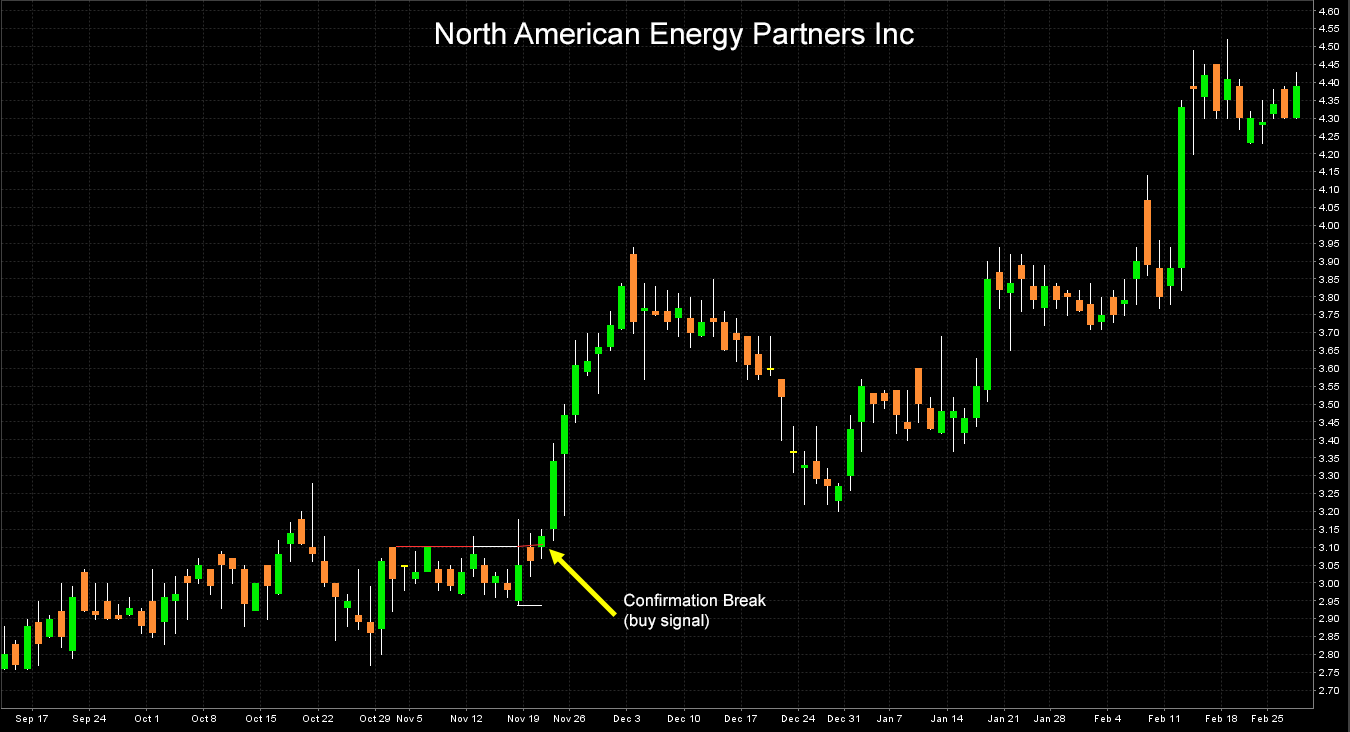
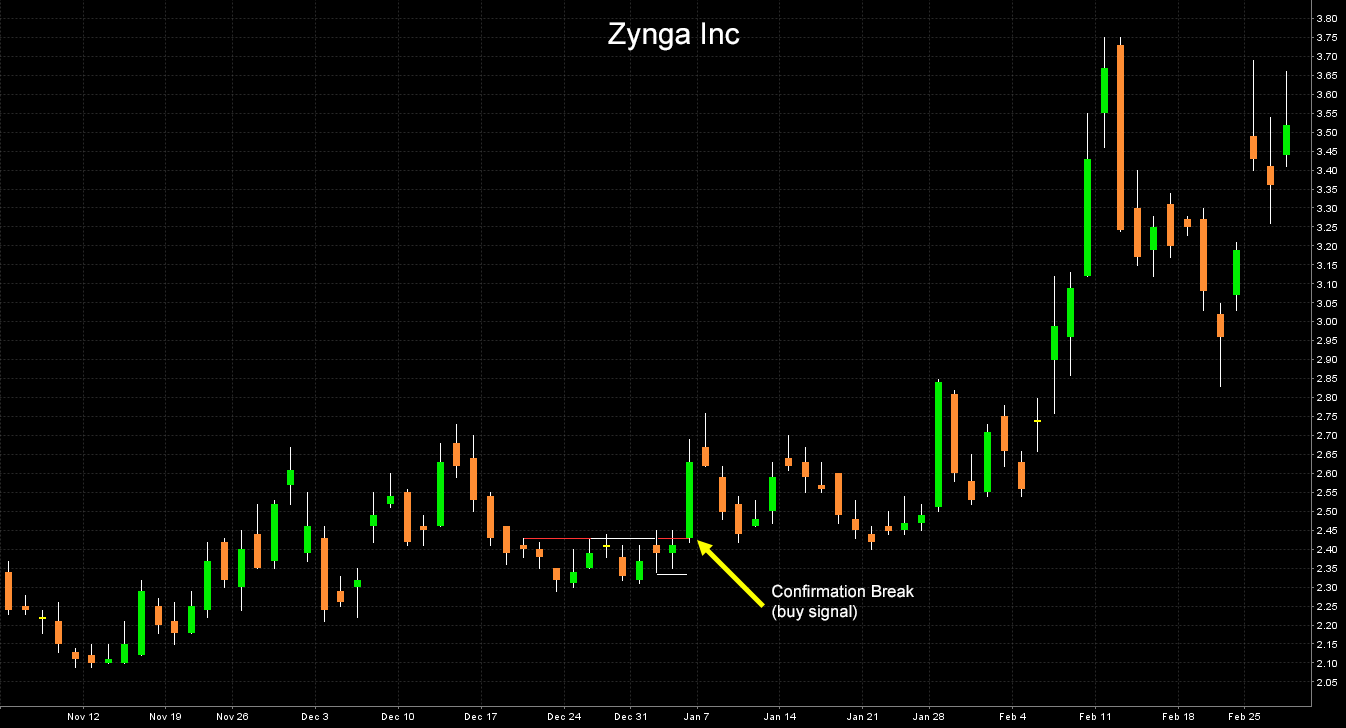
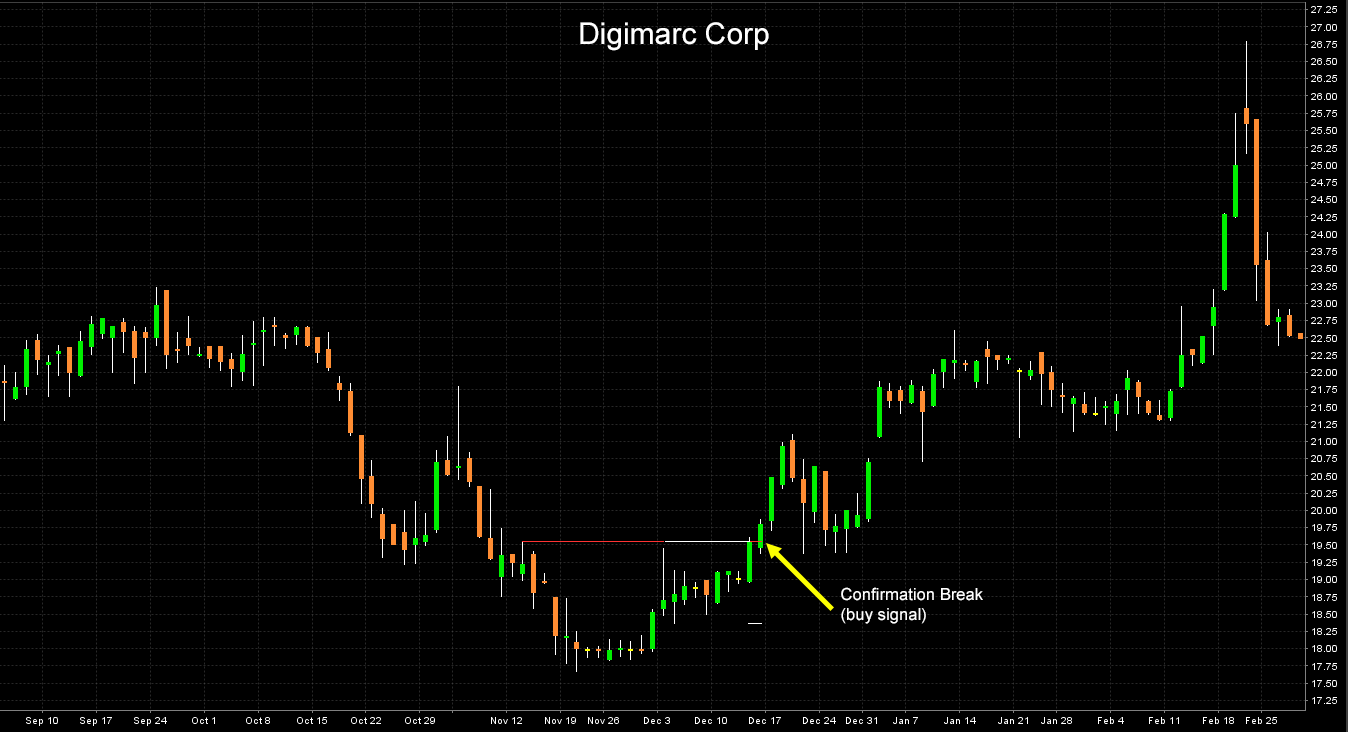
Cases in point
Below are eight real Bottom Right triangles found by YardCharts in the past (Nasdaq, Nyse), which have successfully performed from the day of the buy alarm.
Without first hitting the stop level, the market has rallied starting from the horizontal line a distance equal at least three times the size of the stop loss (equal horizontal-last bounce low).
The relevant bounces and segments are shown in each picture. The bounce segments and colors are shown exactly as they appear on the Trading Panel of Yard Charts.
Some Example

Read also about...


Free Yard Charts Panel
Experience Yard Charts features for free and get ready to use Yard Chart Plus. Check the stock market securities that Yard Chart suggested in the past!
It is very useful for new clients to check past alerts to better understand how the tool works and experiment with the services that YC offers. Even with a more basic functionality than YC plus, Free YC offers the investor the possibility to better understand alerts and feature.
Read moreYard Charts Plus Platform
The techincal analysis software decisive to understand the stock market trends. Through this automated charting tool, Yard Charts gives more insight and support to its clients.
Yard Charts plus is taught for private traders and institutions that are seeking an innovative technical tool to scan the stock market. A professional analitycal approach for more powerful and productive trading.
Read moreYard Charts PPV Platform
Thanks to this analytic tool, our clients can choose their desired alert and only pay for the stocks symbols that they want to see. Scan the stock market and get your alert!
This service is recommended for investors that possess high technical skills who would like to choose their desired alert and only pay for the stocks symbols that they want to see.
Read moreExperience Free Yard Charts, check some patterns!
Try Now