Horizontal Support
Yard Charts technical analysis software is able to discover a Horizontal Support chart pattern
Horizontal Support is mainly a trend continuation YardCharts bullish pattern that is widely present in the current technical literature. It can be expected to take form in a market correction within a greater up trend. Horizontal support can also stand in the way of bear markets that come off recent or less recent market trend reversals from the top.

The market is visibly in an Up-Trend (see segment 1 in picture A). Once it reaches a recent high (point B in picture A), it retraces down some portion of the up-trend. Having established a low point in the retracement (point C in picture A), the market resumes its up-trend and soon breaks above (dotted line F in picture A) the recent high on a closing basis and continues on to establish a fresh new high (point D in picture A). Having established this new high, the markets loses momentum, and eventually retraces down close to the horizontal level (dotted line G in picture A) from which it started its leg up to the new recent high.
Development of a Horizontal Support

The entry point (point C in picture B) for a limited risk bull trade in expectation of the resumption of the recent up-trend is when the market falls close to line A in picture B. Such trade carries a limited risk because the market should not fall lower than line A, below which a stop loss order should be placed. The same trade presents a good risk/reward ratio because if the up-trend were to resume without breaking this support line, the cost of the stop-loss could potentially be covered many times over. Of course, all stocks in all circumstances do not religiously follow this behavior, in fact quite often horizontal lines are intentionally tested by other traders looking to dislodge weak position holders.

YardCharts delivers two kind of horizontal supports that are denominated 5% (not yet, soon on display) and 10% respectively. The 10% alarm is called when the market has retraced down 90% of the distance from the market high in point A to line F in picture C. The 5% alarm is called when the market has retraced down 95% of the distance from the market high in point A to line F in picture C1. Both alarms present advantages and disadvantages with respect to each other. In relation to the HS5%, the HS10% alarm will produce more calls, and will be costlier in case of failure and stop loss. On the other hand, it will catch those "stronger" stocks that will not retrace all the way down to cover 95% of the recent up-trend to resume earlier their rise.

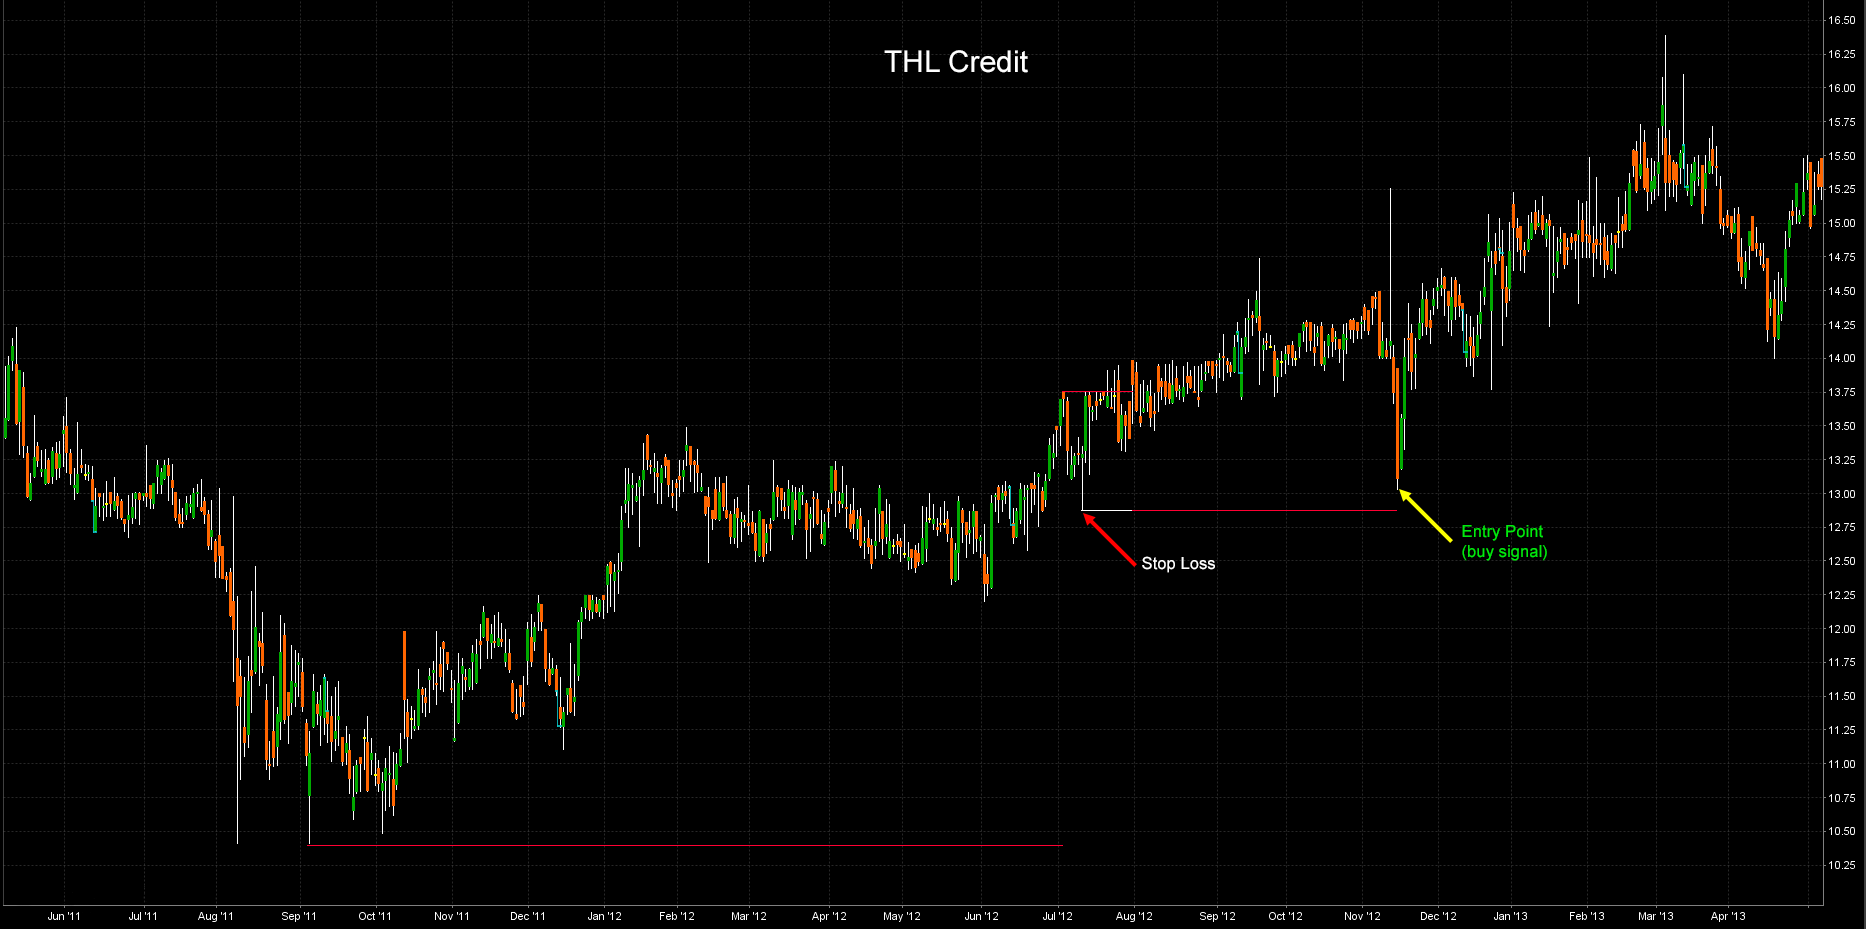
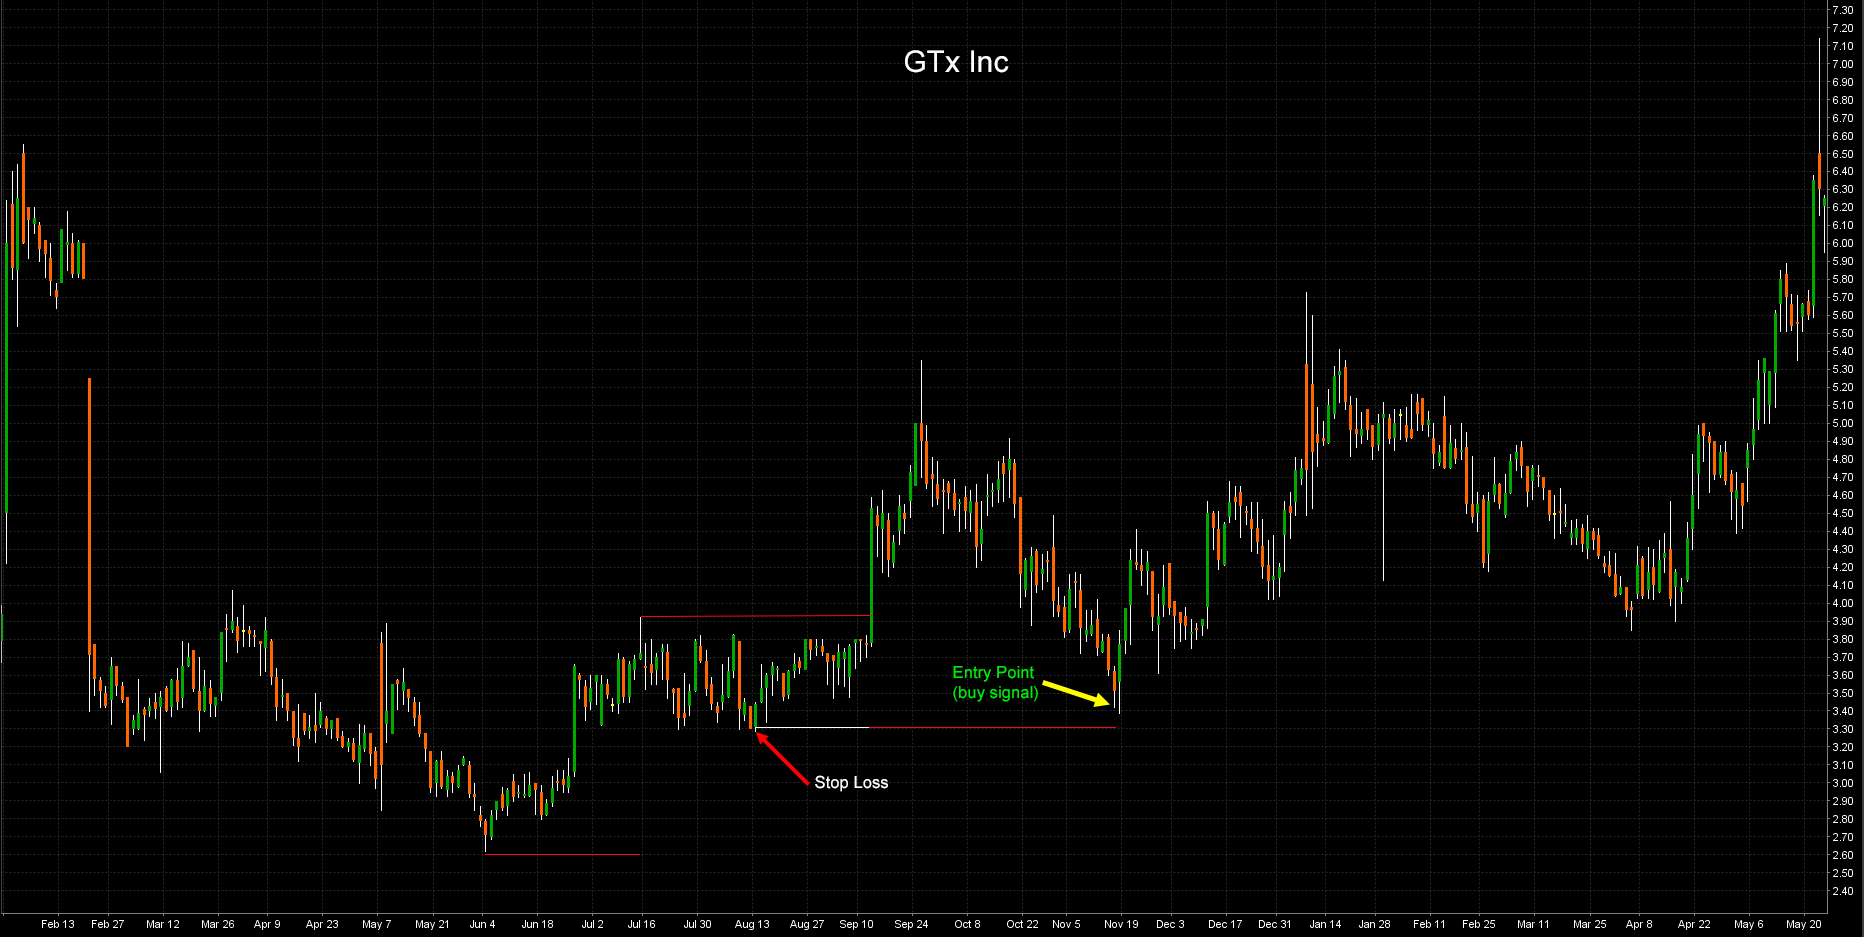
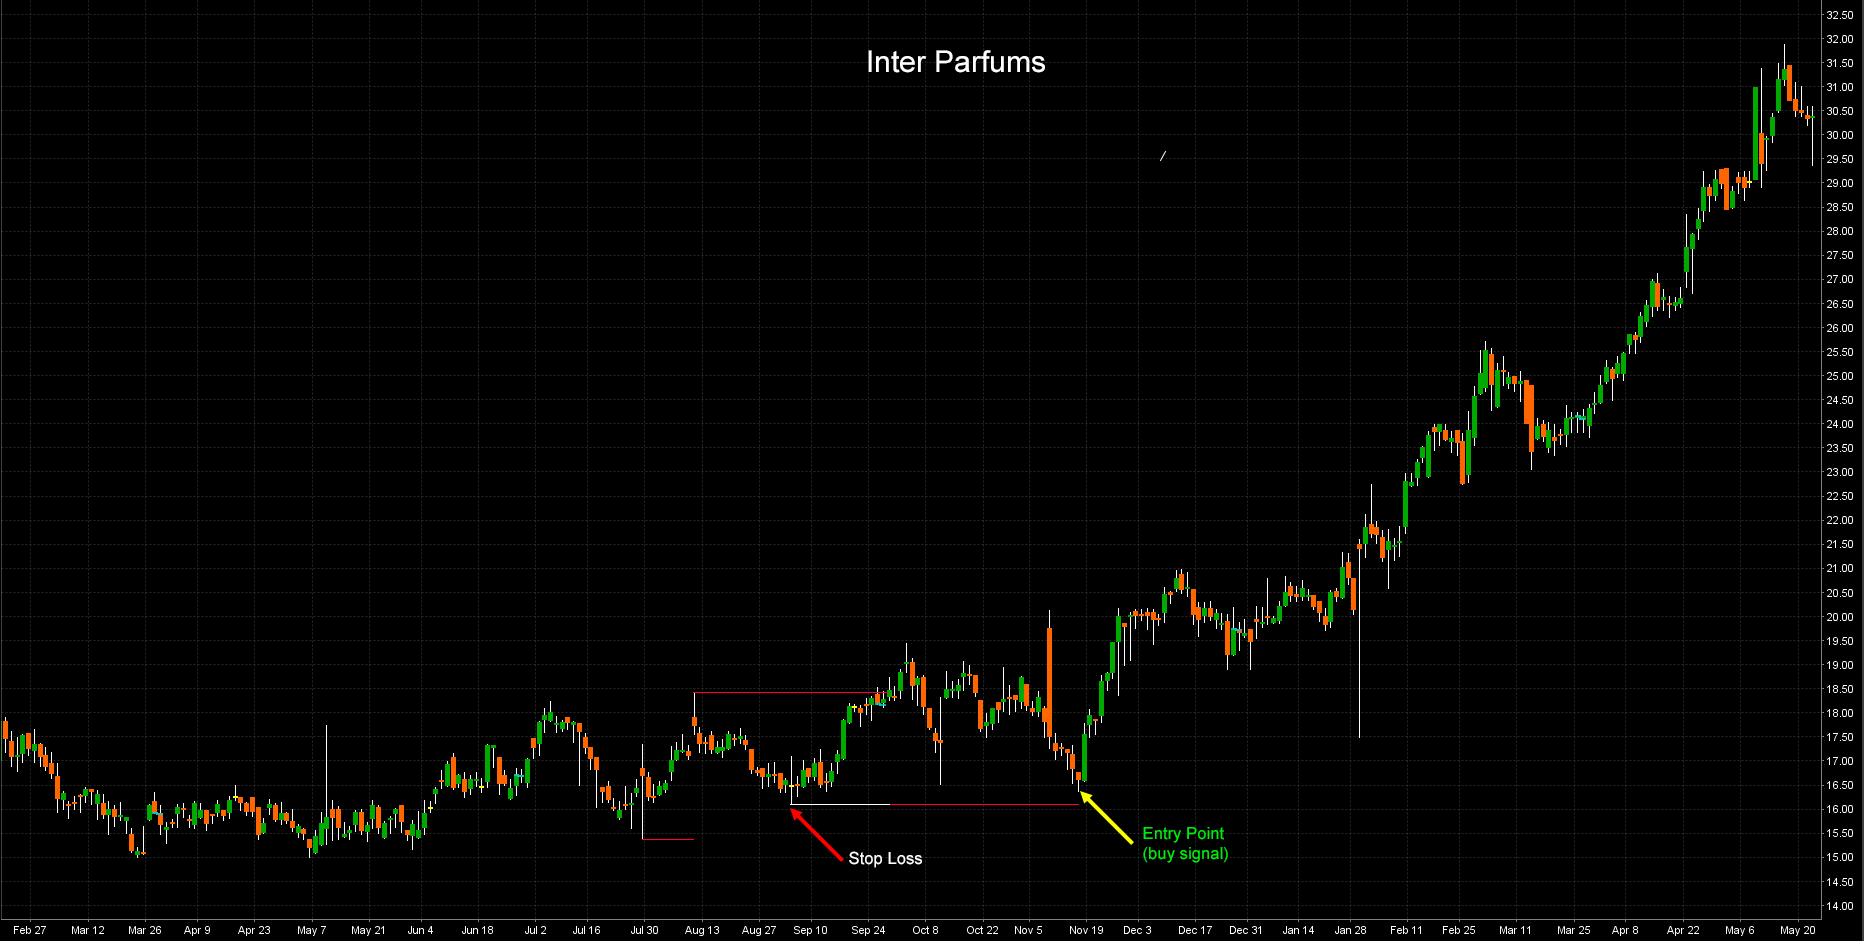
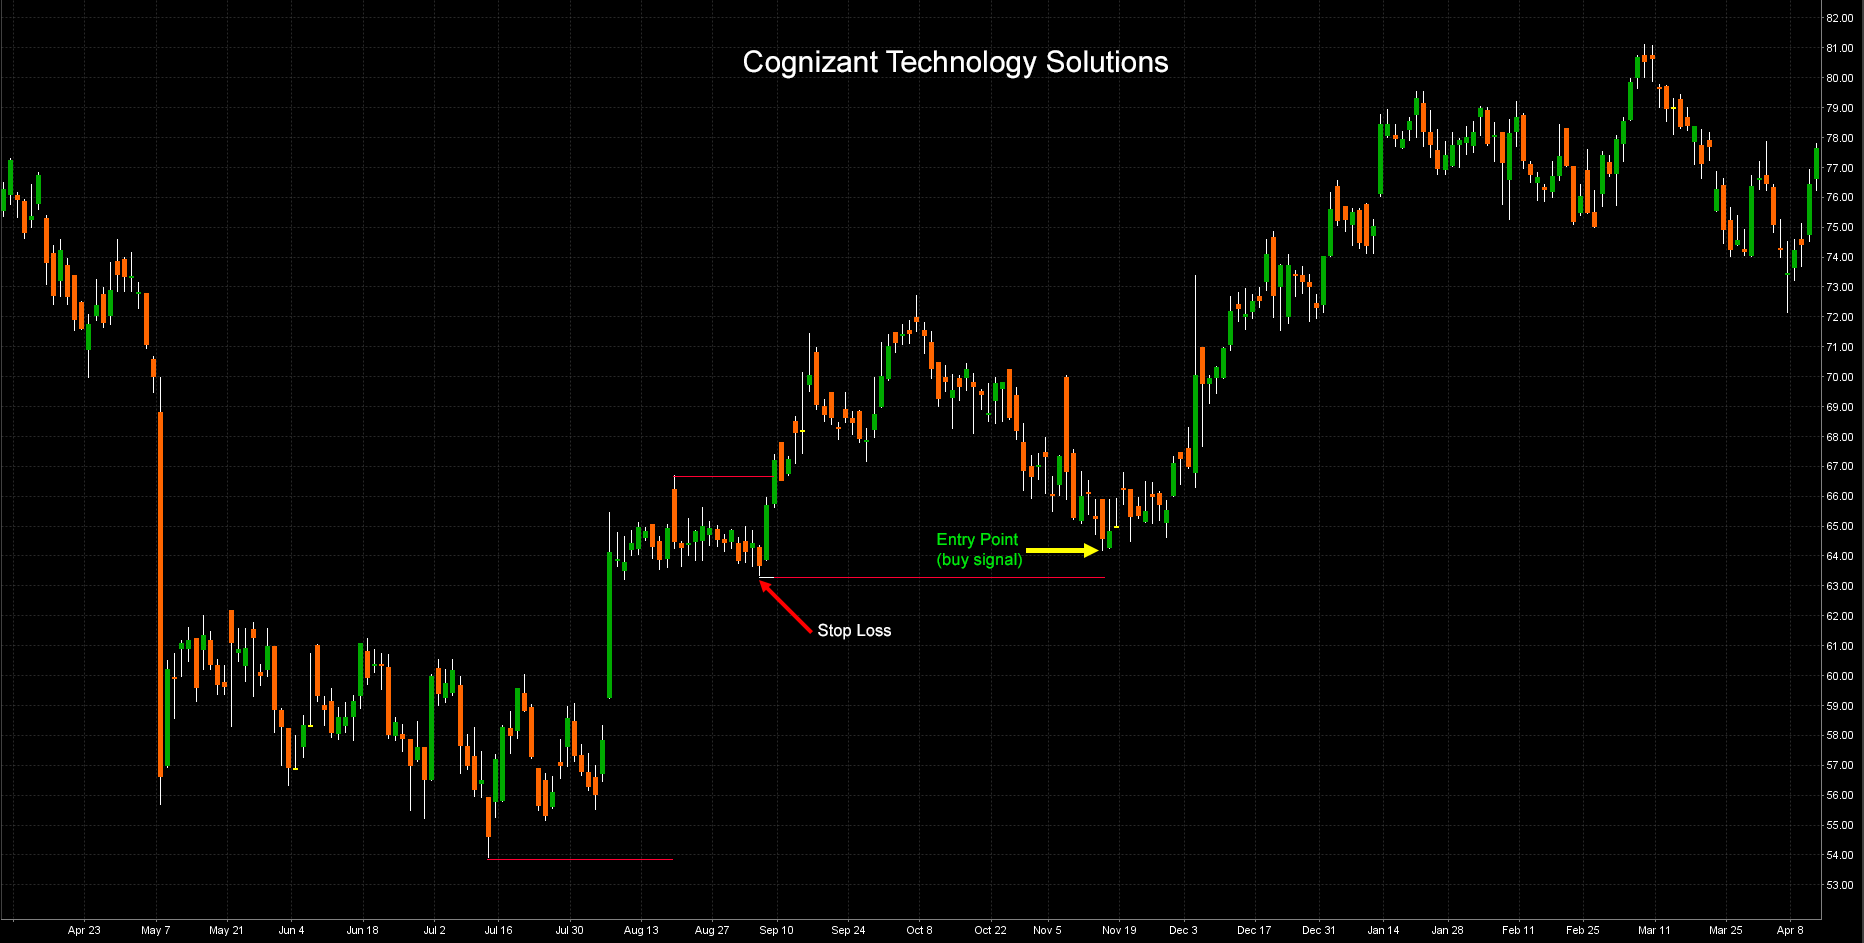
Below are five real Horizontal Supports recently called by Yard that have successfully performed since the day of the buy alarm. In this case, success means that the market in the particular stock, has climbed a distance that is at least equal three times the entry point stop loss differential without hitting the stop-loss level. Reference lines, segments and colors are shown exactly as they appear in Section Trading Alarms of YardCharts.

Read also about...


Free Yard Charts Panel
Experience Yard Charts features for free and get ready to use Yard Chart Plus. Check the stock market securities that Yard Chart suggested in the past!
It is very useful for new clients to check past alerts to better understand how the tool works and experiment with the services that YC offers. Even with a more basic functionality than YC plus, Free YC offers the investor the possibility to better understand alerts and feature.
Read moreYard Charts Plus Platform
The techincal analysis software decisive to understand the stock market trends. Through this automated charting tool, Yard Charts gives more insight and support to its clients.
Yard Charts plus is taught for private traders and institutions that are seeking an innovative technical tool to scan the stock market. A professional analitycal approach for more powerful and productive trading.
Read moreYard Charts PPV Platform
Thanks to this analytic tool, our clients can choose their desired alert and only pay for the stocks symbols that they want to see. Scan the stock market and get your alert!
This service is recommended for investors that possess high technical skills who would like to choose their desired alert and only pay for the stocks symbols that they want to see.
Read moreExperience Free Yard Charts, check some patterns!
Try Now