Bottom End Sweep
Yard Charts technical analysis software is able to discover a Bottom end Sweep chart pattern
Bottom End Sweep is a YardCharts market reversal bullish pattern comparable to an imaginary right-angled triangle. It is made up of two sides that meet at a 90° angle, which are linked by a hypotenuse. In Yard's technical analysis we make the following associations:

- Long side: The horizontal line drawn by uniting two or more, approximately equal market highs in a given temporal segment. (See line 1, in picture A);
- Short side: The imaginary vertical line with a length that is equal to the distance from the horizontal line to the market low formed under the horizontal. (See line 2, in picture A);
- Hypotenuse: The imaginary sloping line that results from linking the market lows corresponding to the bounces formed under the horizontal. (See line 3, in picture A).
The ideal model of Bottom End Sweep
- The bounces underneath the horizontal line must be at least two, preferably three, and their lows are in descending order. (See Picture B)
- Any of these bounces are preferable when the number of bars corresponding to the down-move from the horizontal to the bounce low is greater than or equal to the number of bars that make the up-move from the bounce low back to the horizontal line. This means that, within the bounces, the down velocity is slower than the up velocity. Not all bounces in every triangle will develop exactly as such, but it is advisable that the last and closing bounce present this characteristic.
- The formation of a Bottom End Sweep is confirmed when the market has performed at least 2 bounces under the horizontal and satisfies the following two conditions:
- As soon as the market breaks the horizontal from below, the market rises up to a minimum distance (50% of the short side) above the horizontal, peak 1 in picture B.
- As soon as the level above the horizontal, peak 1 has been touched, the market retraces back within a close range to the horizontal. This retracement represents the entrypoint. See picture B.
- A stop loss is advisable within a certain percentage point below the blue line, depending on how deep is the triangle and the trader's risk appetite. In any case, if the market falls back below the last bounce low, a stop loss is paramount as this means the market has failed the pattern.

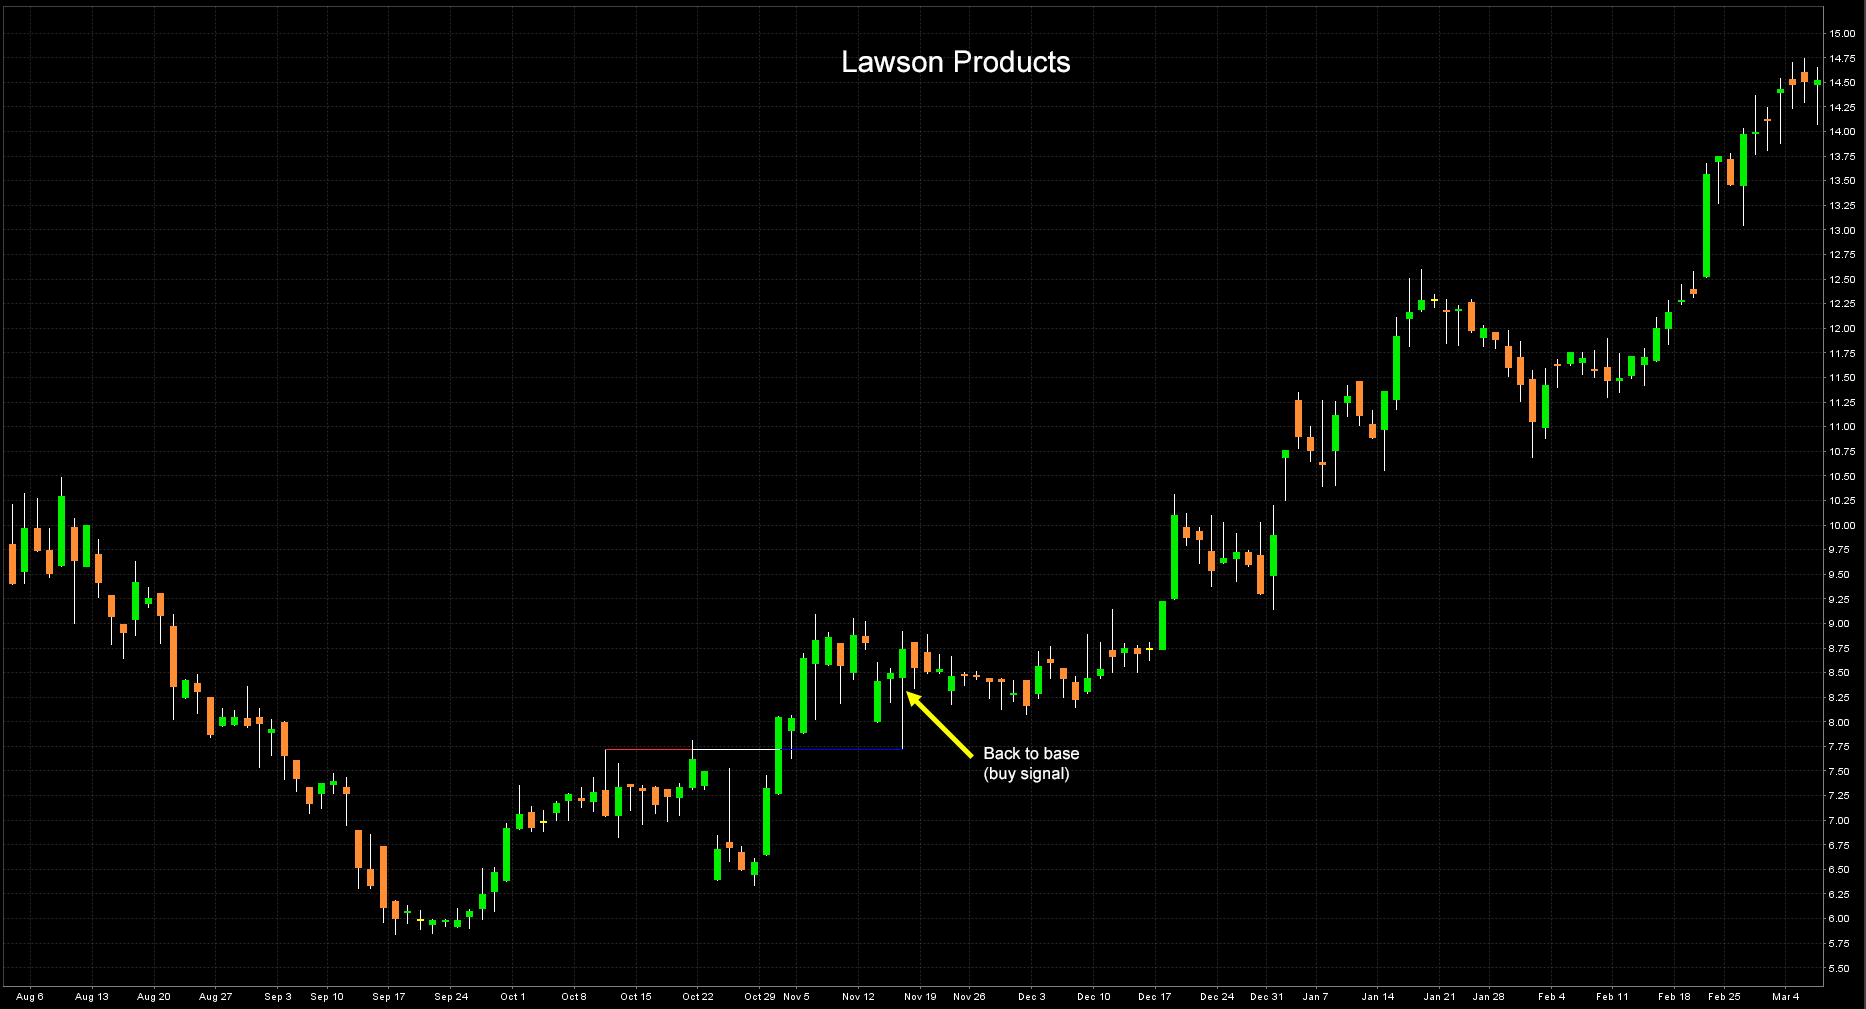
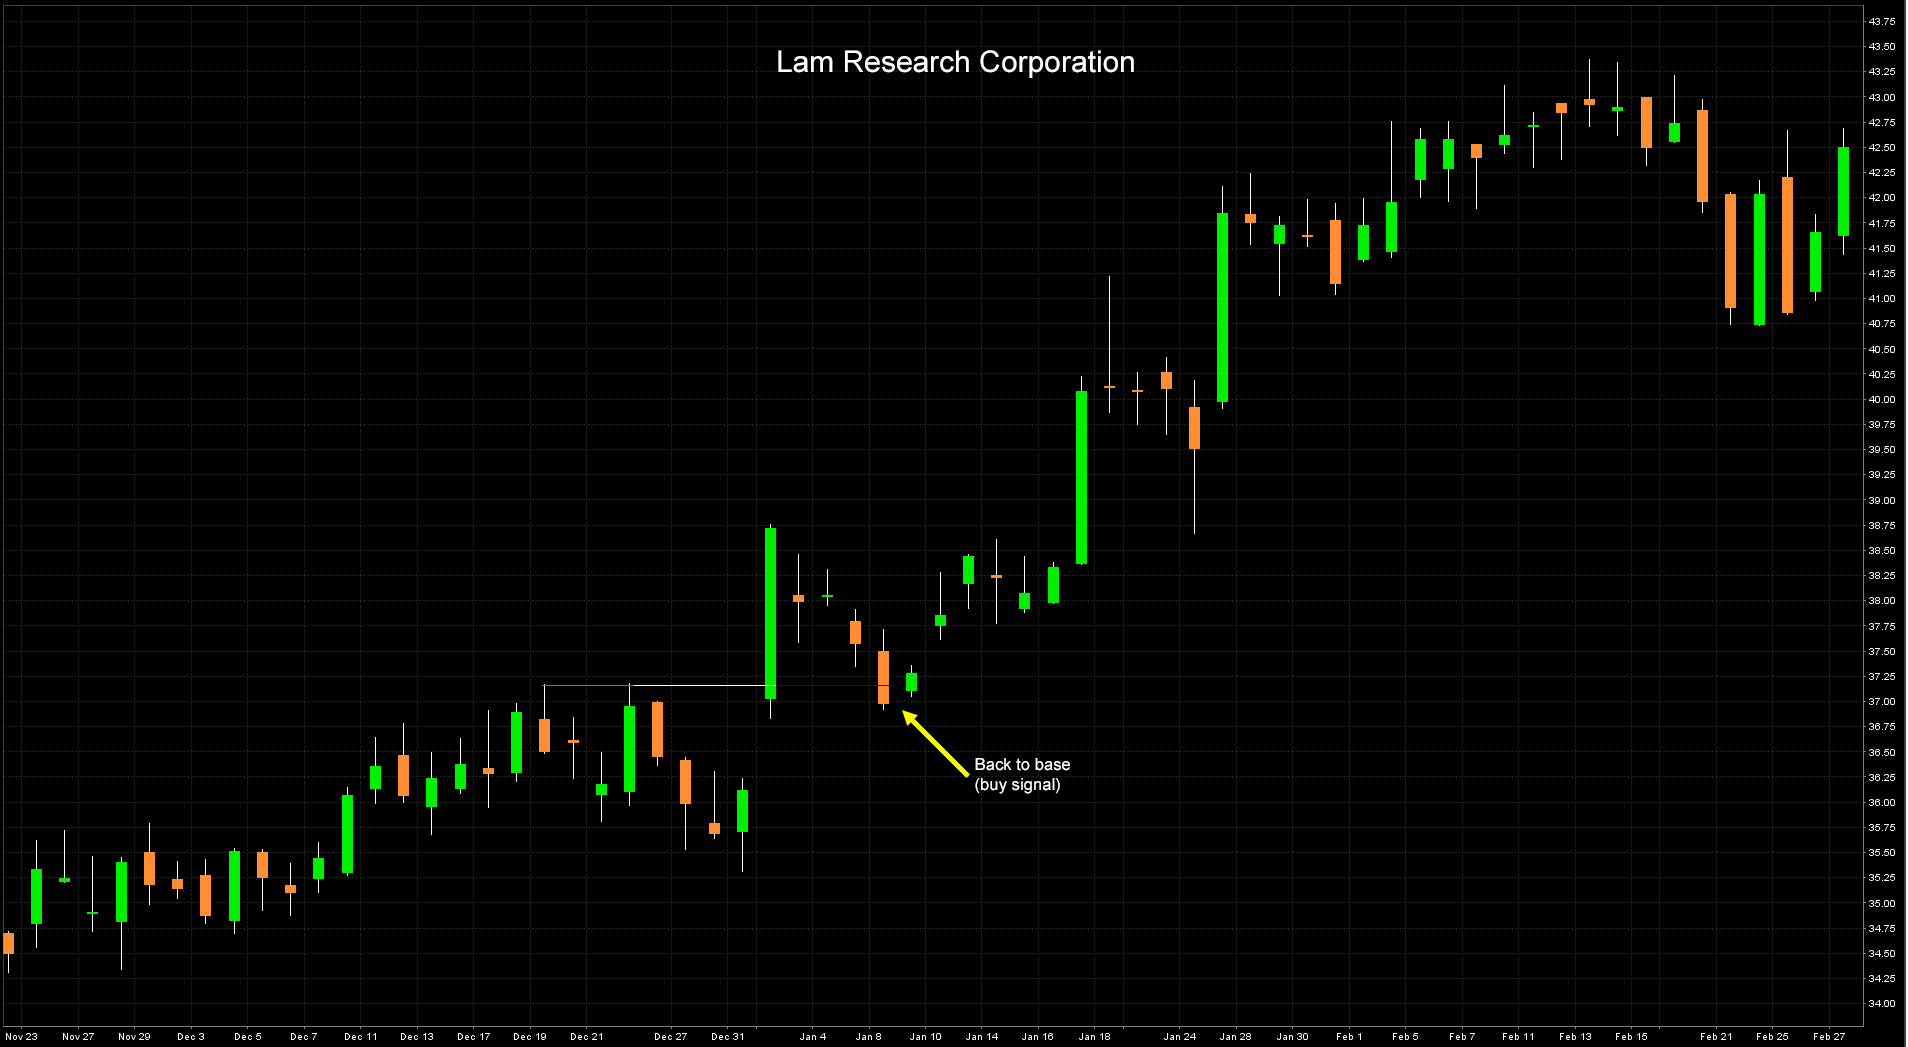
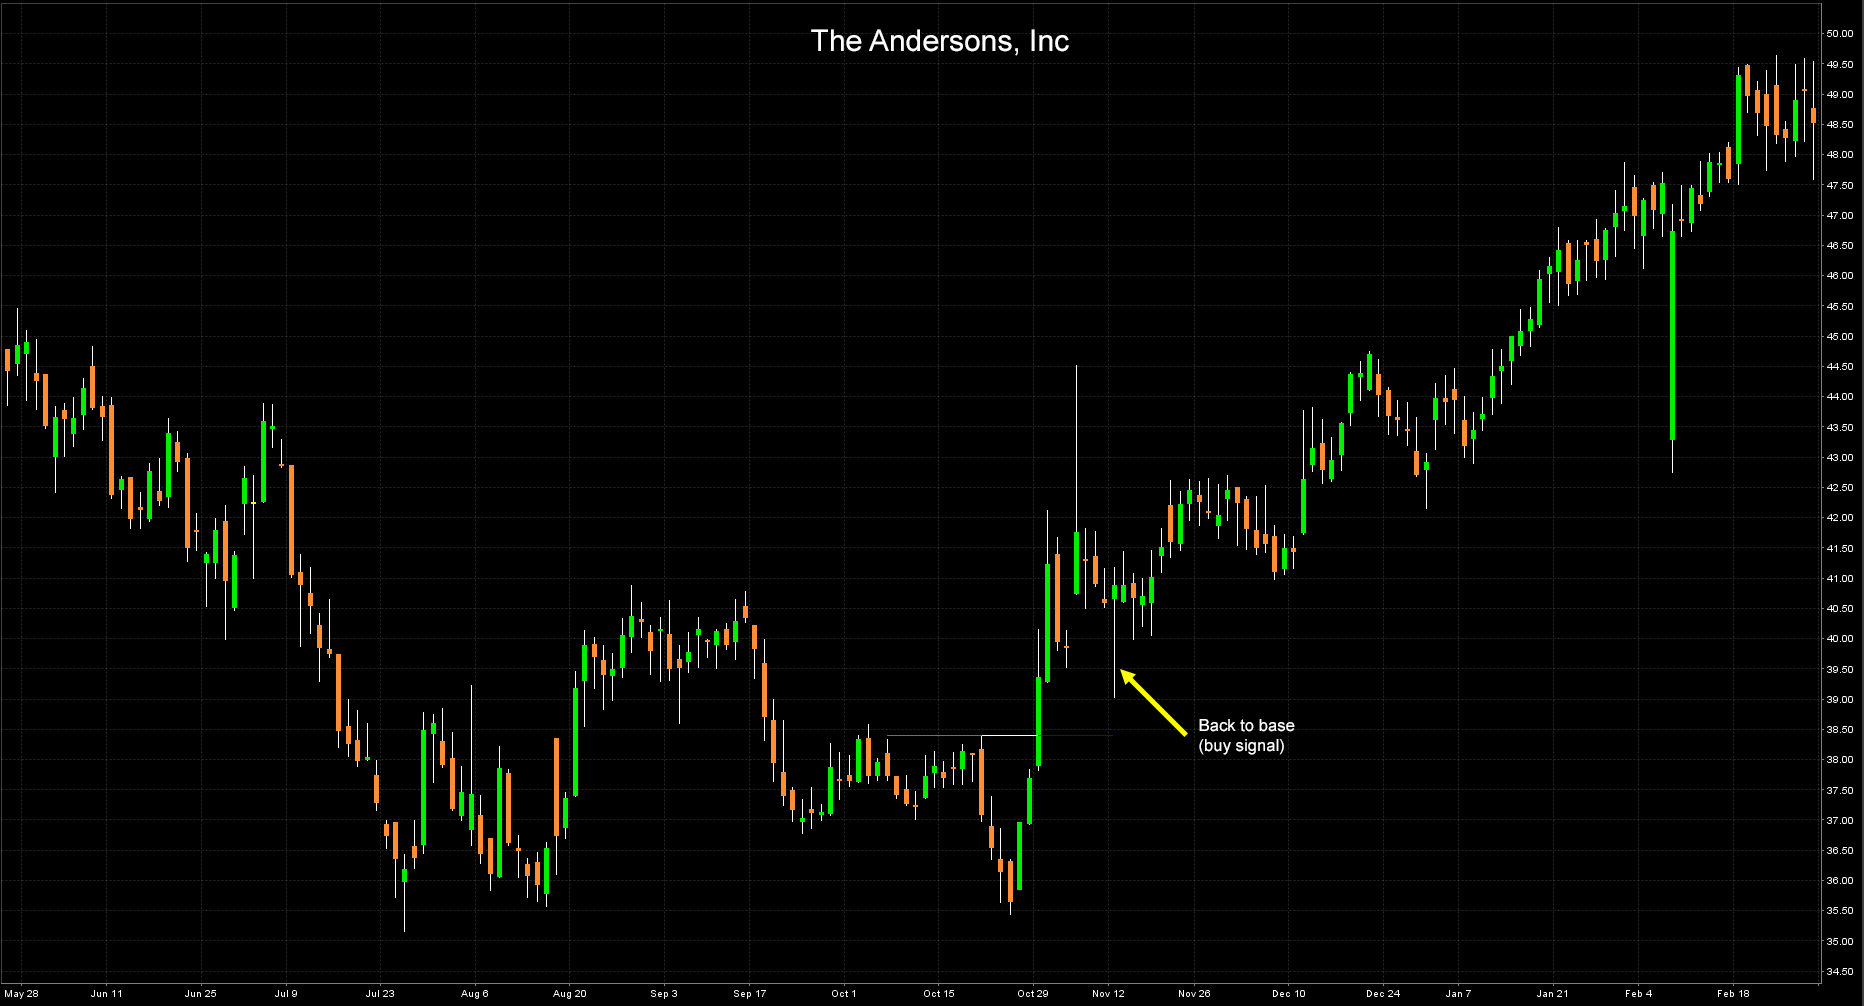
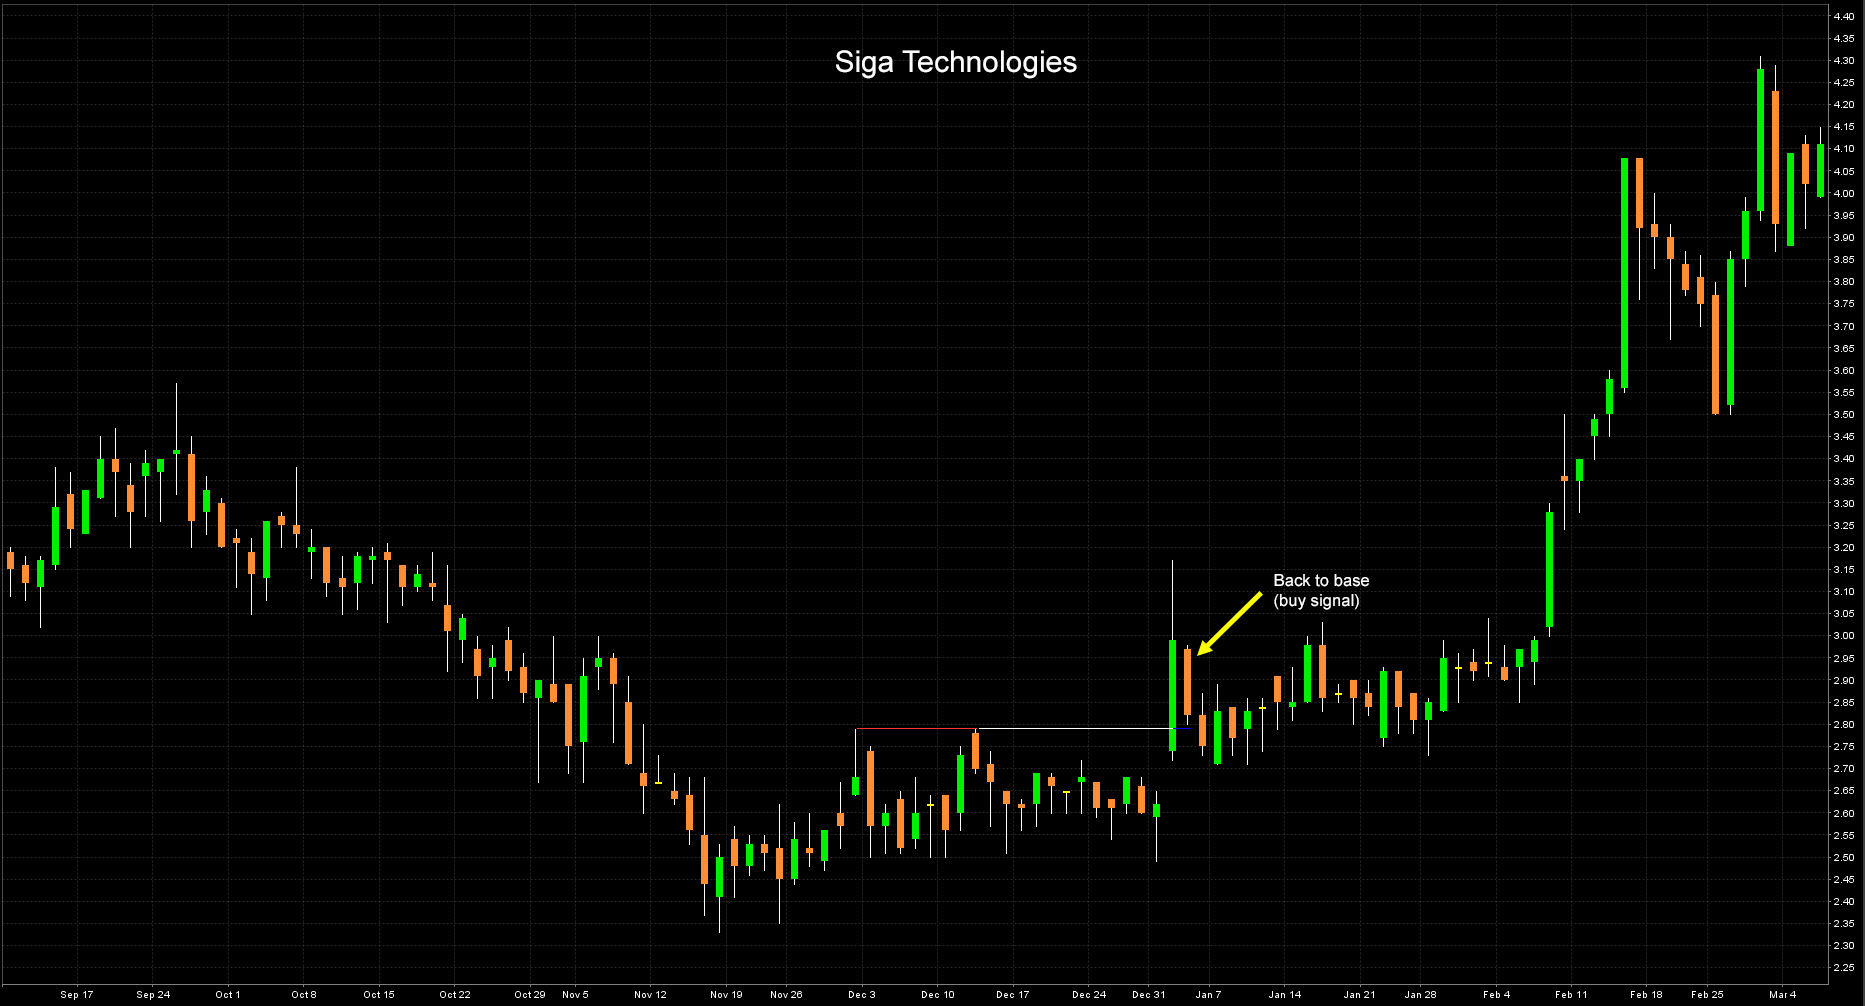
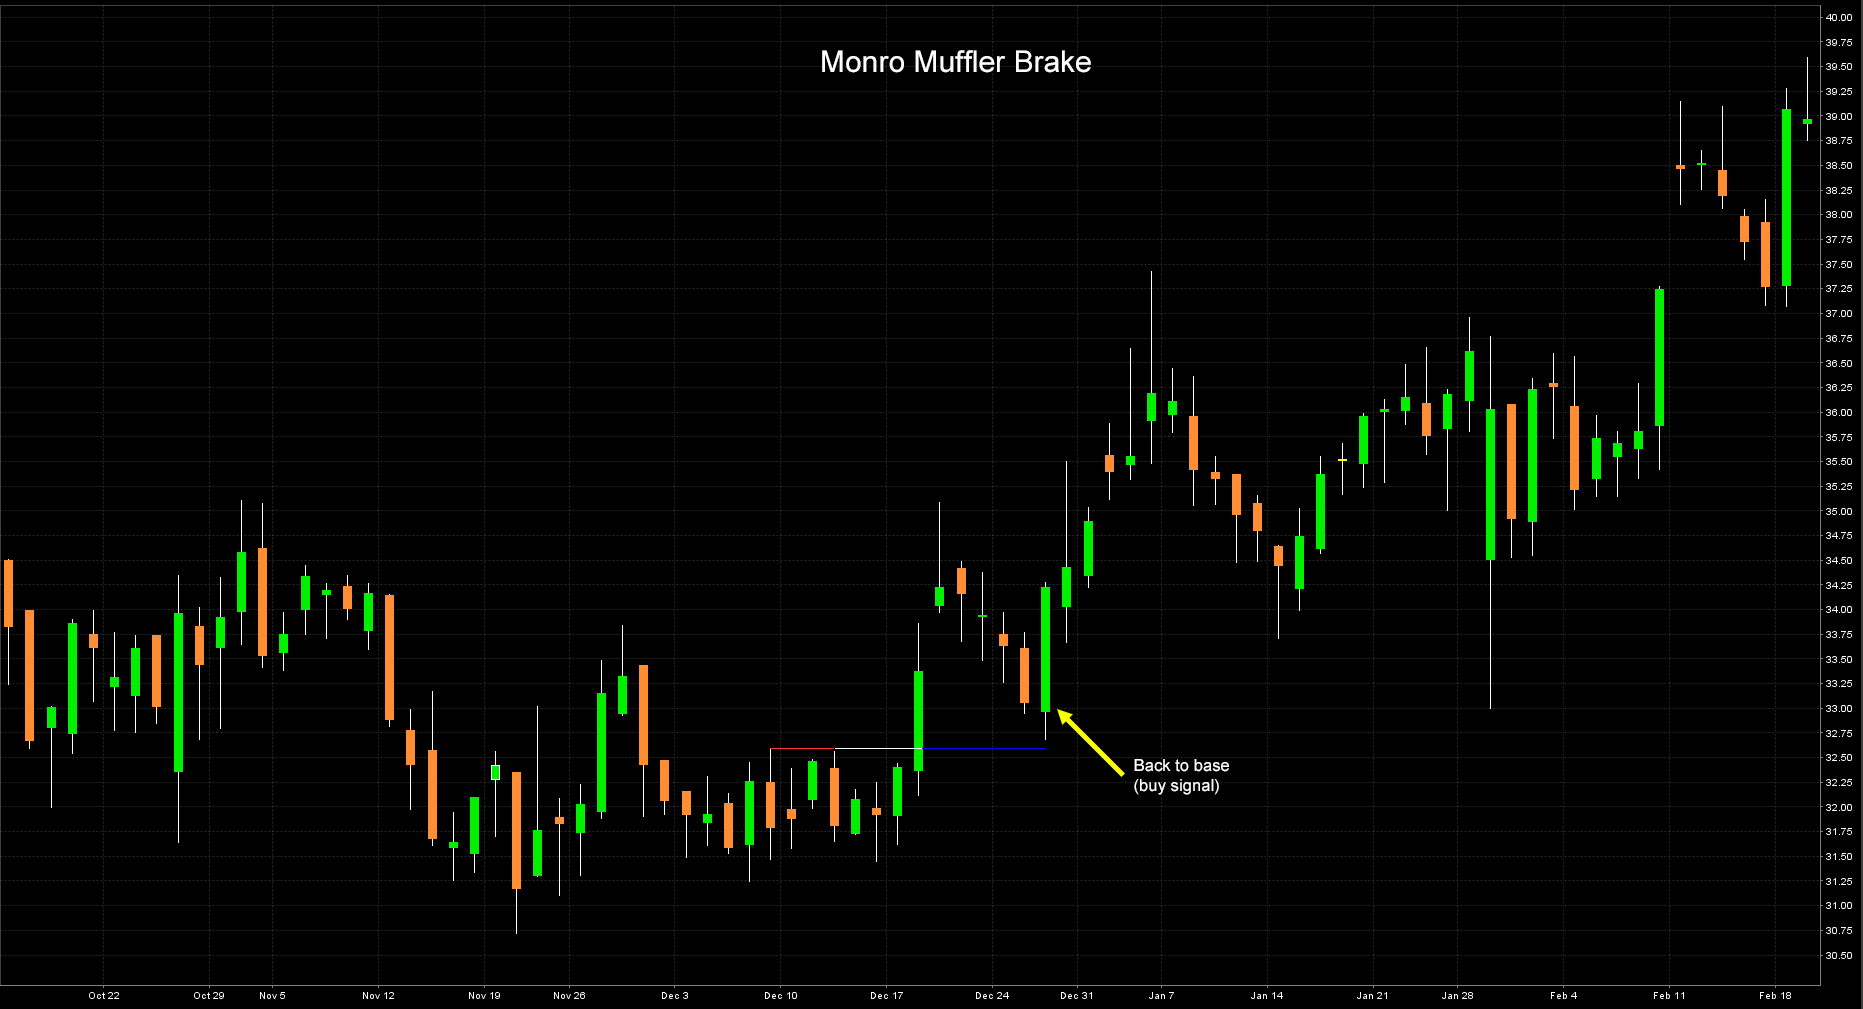
Cases in point
Below are shown 5 real Bottom End Sweeps found by Yard Chats in the recent past (Nasdaq and NYSE markets), which have successfully performed shortly after the day of the buy alarm.
That means the market in the particular stock without first hitting a stop placed 10% below the entry point has risen from the entry point as far as twice the size of the short size.
Some Example
Read also about...


Free Yard Charts Panel
Experience Yard Charts features for free and get ready to use Yard Chart Plus. Check the stock market securities that Yard Chart suggested in the past!
It is very useful for new clients to check past alerts to better understand how the tool works and experiment with the services that YC offers. Even with a more basic functionality than YC plus, Free YC offers the investor the possibility to better understand alerts and feature.
Read moreYard Charts Plus Platform
The techincal analysis software decisive to understand the stock market trends. Through this automated charting tool, Yard Charts gives more insight and support to its clients.
Yard Charts plus is taught for private traders and institutions that are seeking an innovative technical tool to scan the stock market. A professional analitycal approach for more powerful and productive trading.
Read moreYard Charts PPV Platform
Thanks to this analytic tool, our clients can choose their desired alert and only pay for the stocks symbols that they want to see. Scan the stock market and get your alert!
This service is recommended for investors that possess high technical skills who would like to choose their desired alert and only pay for the stocks symbols that they want to see.
Read moreExperience Free Yard Charts, check some patterns!
Try Now